Morning Report – Pending home sales 6/30/14

Vital Statistics:


Last Change Percent
S&P Futures 1951.4 -0.6 -0.03%
Eurostoxx Index 3231.3 3.4 0.11%
Oil (WTI) 105.4 -0.3 -0.28%
LIBOR 0.231 -0.004 -1.66%
US Dollar Index (DXY) 79.99 -0.054 -0.07%
10 Year Govt Bond Yield 2.52% -0.02%
Current Coupon Ginnie Mae TBA 106.8 0.1
Current Coupon Fannie Mae TBA 106.1 0.1
BankRate 30 Year Fixed Rate Mortgage 4.14


Stocks are flat this morning on no real news. Bonds and MBS are flat.
Pending Home Sales increased 6.1% month-over-month in May, according to the NAR. All four regions experienced gains with the Northeast and the West experiencing the biggest gains. First time homebuyers accounted for 27% of new sales. Again, most of the action has been at the higher price points, while sales for homes under 250k are actually down 10%. Meanwhile, apartment rents are expected to increase 8% over the next few years.
The ISM Milwaukee index fell to 60.57 from 63.49 the previous month. The Chicago Purchasing Manager’s Index also fell.
This week promises to be full of economic data, but it is a short week. Friday the market will be closed and I believe FINRA is recommending an early close for the bond market on Thursday. So expect a flurry of activity on Thursday after the jobs report and then a dull market as most of the Street will be on the L.I.E. by noon.
RealtyTrac has sliced and diced the data on distressed discounts. As expected, vacant properties take a big hit – in the 25% range, but bank-owned properties overall sold at a 3 percent premium on average. That said bank-owned vacant properties still had a deep discount.
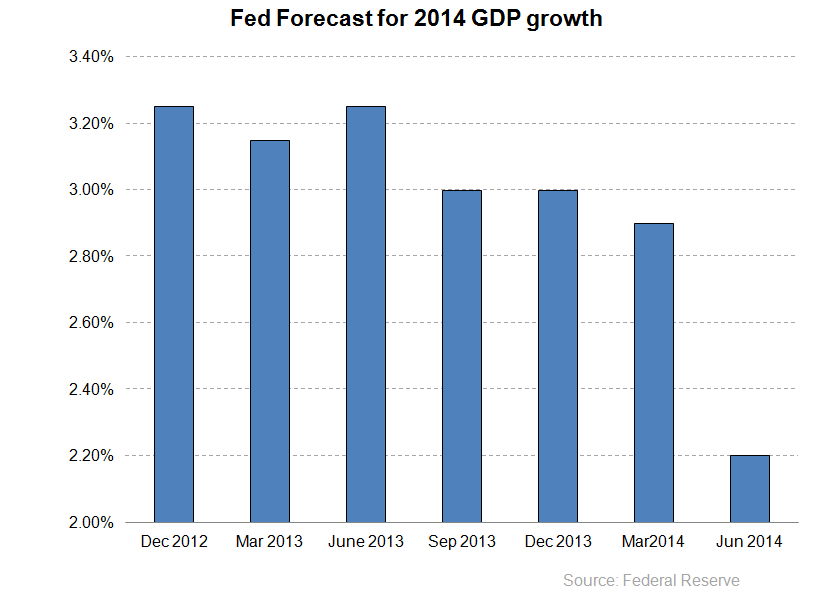
Freddie Mac has its mid year economic update and forecasts. They expect GDP to grow at 3% over the next couple of quarters. Home prices are expected to rise 5% this year and sales are expected to be just shy of 5.5 million units.
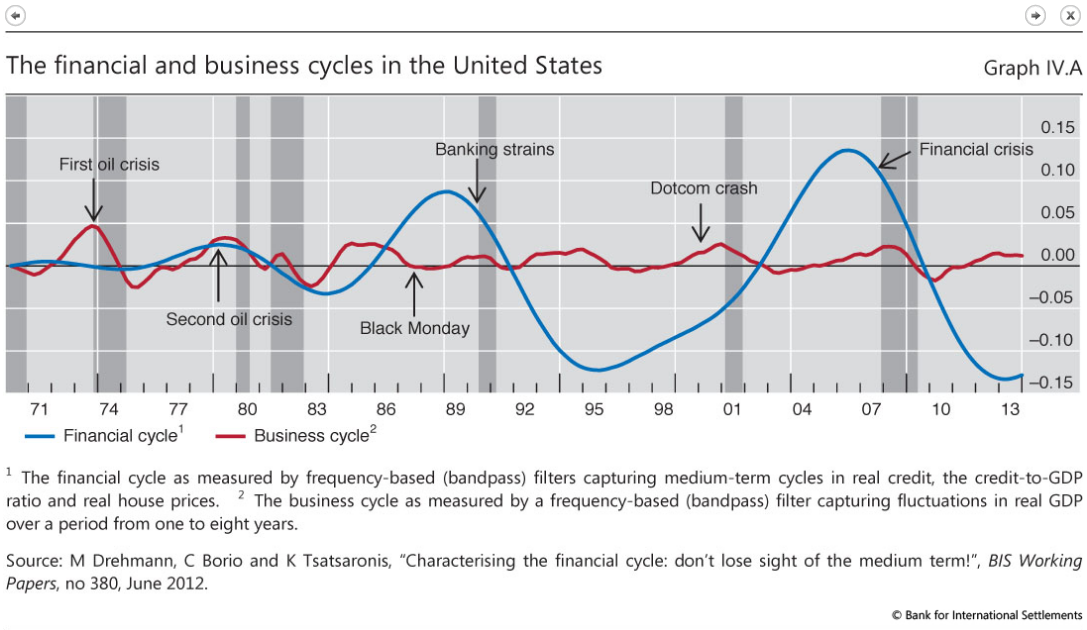
Most people have noticed the rally in US Treasuries, but have not been focusing on the rally in emerging market debt. The BIS is worried about a potential bubble brewing in sovereign debt markets worldwide. The BIS distinguishes between financial cycles (which last 15-20 years and are characterized by debt and asset prices) and business cycles, which last 1 – 8 years. According to BIS, we have just bottomed from our financial cycle, and are finally on the upswing.

Note to ATiM-ers.  I will be in the belly of the beast (DC) early next week, if anyone wants to get together for drinks / dinner…

Morning Report – Homebuilder earnings 6/27/14

Vital Statistics:


Last Change Percent
S&P Futures 1944.2 -4.5 -0.23%
Eurostoxx Index 3230.7 -2.5 -0.08%
Oil (WTI) 106.1 0.2 0.23%
LIBOR 0.235 0.001 0.21%
US Dollar Index (DXY) 80.14 -0.081 -0.10%
10 Year Govt Bond Yield 2.52% -0.01%
Current Coupon Ginnie Mae TBA 106.6 0.0
Current Coupon Fannie Mae TBA 106.1 0.1
BankRate 30 Year Fixed Rate Mortgage 4.16


Stocks are lower this morning on no real news. Bonds and MBS are up.
KB Home reported second quarter earnings this morning. Revenues increased 8% on a 10% increase in average selling prices and a 2.5% decline in deliveries. Margins continued to expand. It will be interesting to see how long the builders can keep increasing the top line through price increases and volume decreases. The stock is up an eighth this morning.
Lennar also reported yesterday. Revenues increased 28% on a 12% increase in deliveries and a 14% increase in ASPs. Like KB, margins are increasing. Lennar is ready to launch a starter home product once first time homebuyers are able to get mortgages. (Gee, Lennar, don’t you have a mortgage origination arm?). The spring selling season was weaker than expected, but the homebuilding market is heating up. May was a great month, apparently.
The Kansas City Fed Manufacturing Index came out yesterday. It eased somewhat, but is still reasonably strong. Some companies mentioned that it is hard to find skilled workers, however once company said the problem was finding “workers who are reliable and possess a strong work ethic.” Overall, the comments seemed relatively bullish, with another company saying that “Compensation levels have been increased within all grades to compete with other employers. Production employees received 4-5.5% average wage increases this past year compared to 3% for all other areas of the company.” The missing piece to the inflation picture has been wage growth. If we are starting to see it, bond investors should start eyeing the exit.
Jack Lew spoke yesterday, and announced that the HAMP program would be extended through 2016. Also, the Administration will tap Treasury funds to push for more low-income rental housing. He also called on Congress to allow Ginnie Mae to securitize loans made under the FHA risk-sharing program. Treasury is also seeking public comments on what it can do to foster a more robust private-sector mortgage securitization market.

Morning Report – Sovereign Debt Bubble? 6/26/14

Vital Statistics:


Last Change Percent
S&P Futures 1949.0 -0.4 -0.02%
Eurostoxx Index 3253.1 0.7 0.02%
Oil (WTI) 106.2 -0.3 -0.27%
LIBOR 0.234 0.000 0.11%
US Dollar Index (DXY) 80.23 0.007 0.01%
10 Year Govt Bond Yield 2.54% -0.02%
Current Coupon Ginnie Mae TBA 106.5 0.0
Current Coupon Fannie Mae TBA 105.9 0.1
BankRate 30 Year Fixed Rate Mortgage 4.16


Stocks are flat this morning after a disappointing personal spending report. Bonds and MBS are up
Personal Incomes rose .4% in May, in line with expectations, but spending came in at .2%, lower than the .4% estimate. Services spending dropped, while spending on durables increased. The PCE core rate (the Fed’s preferred measure of inflation) came in at 1.5%, lower than the Fed’s target rate
Initial Jobless Claims came in at 312k, more or less in line with expectations.
Note that the Markit PMI data came out yesterday and both the composite and the services numbers were at post-recession highs. Markit is forecasting a payrolls number next week of 250k, which is way above the ADP forecast of 208k and the Street forecast of 209k.
The war on the financial system continues. NY AG Eric Schneiderman just announced he is suing Barclay’s. Remember, the road to the NY Governor’s Mansion is paved with Wall Street lawsuits. Separately, Obama nominated the woman who railroaded Arthur Anderson into a guilty plea (only to have it overturned by the Supreme Court) to head the Criminal Division at DOJ. She has a fundamentally dim view of business in general and Wall Street in particular – considers us the wise guys of Wall Street, deserving brutal prosecutorial tactics. And the left wonders why credit is so tight…
Is the worldwide unprecedented easing by central banks causing a bubble in sovereign debt? Wilbur Ross and Steven Roach think so. Remember the PIIGS (Portugal, Ireland, Italy, Greece, Spain) problem children of the EU? Their 10 year bonds are yielding: Portugal: 2.84%, Greece 5.85%, Portugal, 3.5%, Spain 2.64%, Ireland, 2.34%. Irish 10 year sovereigns are trading at a lower yield than US treasuries. Two years ago, they were yielding 14%. Memories are short..
On the plus side, mortgage rates continue to fall, which is helping drive business. Chart: Bankrate 30 year fixed rate mortgage:

Morning Report – Terrible GDP revision, but look at the technical notes 6/25/14

Vital Statistics:

Last Change Percent
S&P Futures 1939.1 -4.1 -0.21%
Eurostoxx Index 3250.8 -34.0 -1.04%
Oil (WTI) 106.1 0.0 0.05%
LIBOR 0.234 0.000 0.11%
US Dollar Index (DXY) 80.16 -0.170 -0.21%
10 Year Govt Bond Yield 2.54% -0.04%
Current Coupon Ginnie Mae TBA 106.6 0.1
Current Coupon Fannie Mae TBA 105.9 0.1
BankRate 30 Year Fixed Rate Mortgage 4.19
Markets are lower this morning after a dismal revision to first quarter GDP. Bonds and MBS are flying on the number
First quarter GDP fell at a downward revised rate of 2.9% in the first quarter. The initial estimate was a .1% increase, which was revised downward to -1%, which was finally revised down to 2.9%. There were some obamacare-related revisions in personal consumption expenditures which drove the decrease in the number.
Personal consumption rose 1% in Q1, versus an expected increase of 2.4%.Finally, durable goods orders fell 1% although if you strip out defense, air and transportation the number isn’t that bad.
Was first quarter GDP as bad as all that? I think you have to take the number with a huge grain of salt. Weather did have an effect, but it looks like there was some obamacare bean-counting issues happening that made the number so low. Simply put, the last time we had a similar GDP report was 2008 / 2009 and no one is going to argue that Q1 was as bad as then. The rest of the data is reasonably strong. Chalk this one up to technical revisions. The bond market is taking that view as well.
Case in point: The Markit PMI and Services PMI numbers came in above 61, which is a good number. If the ISM reported a PMI number above 61, we would be talking a manufacturing pace that would correspond to 4% GDP growth. Of course manufacturing doesn’t have the impact on the economy it used to, but still…
Insurers are beginning to tally up the effects of Obamacare and what it will mean for premiums next year. People enrolled in the new plans under Obamacare are showing higher rates of serious health conditions than other insurance customers, who tend to hang on to their old plans. This means prices are going way up next year for these new plans. So, either premiums are going to have to rise a lot, or government subsidies will have to rise a lot. Remember, the only reason why the insurance companies went along with Obamacare in the first place is because the government is going to backstop any losses they take. If Obama demands that they hold down prices to keep voters happy, then government will have to pick up the tab. Maybe Elmendorf’s CBO can figure out a way to obfuscate the issue so the Administration can claim it is bending the cost curve down, or at least claim we cannot say Obamacare is increasing costs.
The upshot: Higher healthcare costs = less disposable income. Which means less spending and a weaker economy. If there is a multiplier on health care spend, it cannot be that big.
Mortgage Applications fell 1% last week as well. Both purchases and refis fell.
Foreclosure starts fell to 78.8k in April, according to Black Knight Financial Services. We are starting to see more progress in the judicial states, however Massachusetts instituted a new foreclosure prevention (home price appreciation prevention) program, which is keeping its pipeline high.

Morning Report – Housing data dump 6/24/14

Vital Statistics:


Last Change Percent
S&P Futures 1950.4 -2.6 -0.13%
Eurostoxx Index 3284.3 1.8 0.05%
Oil (WTI) 106.1 0.0 -0.03%
LIBOR 0.234 0.001 0.43%
US Dollar Index (DXY) 80.26 -0.017 -0.02%
10 Year Govt Bond Yield 2.60% -0.03%
Current Coupon Ginnie Mae TBA 106.5 0.0
Current Coupon Fannie Mae TBA 105.6 -0.1
BankRate 30 Year Fixed Rate Mortgage 4.21


Markets are lower this morning on no real news. Bonds and MBS are up small. Philly Fed Head Charles Plosser said that he could see 2.4% GDP growth for the rest of the year and more slack taken out of the labor market.
New Home Sales spiked to 504k in May, much higher than the 439k estimate. The median sales price of a new home was 282k and the seasonally-adjusted estimate of new homes for sale was 189,000, or about 4.5 months’ supply. This Friday, we will hear from homebuilder KB Home when they report second quarter earnings.
Consumer Confidence rose to 85.2 form 83 last month, and higher than the 83.5 forecast on the street. This is the highest level since January 2008. Perceptions on the economy and the job market are improving, although they are still highly negative.
The Richmond Fed Manufacturing Index came in stronger than expected. We are seeing pricing pressures build. Prices paid (the cost of inputs) rose at a 1.11% rate, while prices received rose at a .37% annualized rate. Eventually producers will pass those increases on, which will eventually get inflation closer to the Fed’s comfort zone.
Home prices were flat month-over-month in April, according to the FHFA. On a year-over-year basis, they were up just shy of 6%. Prices are back at July 2005 levels.
Home prices posted an 11% gain, according to Case-Shiller. Home price appreciation is leveling off.
And if that weren’t enough, The Black Knight Financial Services Home Price Report has prices up .9% month-over-month and up 6.4% year-over-year.
The reason for the difference between the reports? FHFA covers only sales with a conforming mortgage, while Case-Shiller covers everything. The Black Knight report uses an algorithm to correct for distressed and short sales. Regardless of the index you use, the easy money has been made in home price appreciation and now we should see house prices begin to track wage growth again.
Treasury Secretary Jake Lew is expected to announce expanded programs to help struggling mortgage borrowers on June 26. The new aid will “build on previous administration initiatives that helped stabilize the housing market.” Treasury said. We know that the administration is considering a program for the first time homebuyer that gives a break on MI payments if they borrower goes through counseling. I doubt that we are going to see something dramatic like an expansion of HARP eligibility dates. The administration also seems to think that easing buyback requirements will loosen credit. It may, it may not. As noted in the article, if it were a game changer, Obama would be announcing it himself, not having Lew do it at a housing conference.

Morning Report – Existing Home Sales 6/23/14

Vital Statistics:


Last Change Percent
S&P Futures 1954.0 0.8 0.04%
Eurostoxx Index 3291.2 -11.1 -0.34%
Oil (WTI) 106.6 -0.2 -0.22%
LIBOR 0.233 0.002 0.87%
US Dollar Index (DXY) 80.32 -0.050 -0.06%
10 Year Govt Bond Yield 2.59% -0.02%
Current Coupon Ginnie Mae TBA 106.5 0.2
Current Coupon Fannie Mae TBA 105.8 0.0
BankRate 30 Year Fixed Rate Mortgage 4.22


Markets are flat this morning on no real news. Bonds and MBS are up.
We have some important housing-related economic news this week, with existing home sales today, Case-Shiller and FHFA home price indices tomorrow. We will also get new home sales tomorrow. We also have some big macro numbers, with personal income and personal spending, and the third revision to Q1 GDP.
The Chicago Fed National Activity Index came in at .21, more or less in line with expectations. The Markit US Manufacturing PMI also improved.
Existing Home Sales rose to 4.89 million in May from an upward-revised 4.66 million in April, according to the National Association of Realtors. This is up 5% on a sequential basis, but down 5% on an annual basis. Total inventory rose 2.2% to 2.28 million homes which represents a 5.6 month inventory (6 months is considered a “balanced” level). The median home price rose to 213,400 which is up 5.1% on an annual basis. Distressed sales were 11%, down from 18% a year ago. The first time homebuyer continues to be MIA, with only 27% of sales going to first-time buyers. All cash sales were 33%, and median time on market was 47 days.
In Yellen We Trust. The bond market is assigning a 100% probability to the idea that the Fed will be able to prevent inflation from rising over 2%. Last week’s spike in CPI caused bonds to sell off for a day, and then Yellen dismissed the report as “noisy.” The thing is, you already have decent inflation at the commodity price level. The thing that is holding back full-blown inflation is wages. Bond investors should watch wage growth like a hawk, and once you start seeing evidence of wage inflation it is time to grab your coat and start heading for the exit.
Speaking of bonds, the SEC is looking into why technology has reduced trading costs for stocks, but not really for bonds. Of course bonds are not stocks, and it is a dealer-driven market. That said, it looks like dealers are going to be forced to reveal more information about their order book.

Morning Report – Chinese property prices 6/20/14

Vital Statistics:


Last Change Percent
S&P Futures 1953.3 3.0 0.15%
Eurostoxx Index 3314.6 -0.3 -0.01%
Oil (WTI) 107.1 0.6 0.58%
LIBOR 0.231 0.001 0.44%
US Dollar Index (DXY) 80.45 0.129 0.16%
10 Year Govt Bond Yield 2.65% 0.03%
Current Coupon Ginnie Mae TBA 106.2 -0.1
Current Coupon Fannie Mae TBA 105.4 0.0
BankRate 30 Year Fixed Rate Mortgage 4.22


Stocks are up on no real news this morning. Bonds and MBS are down.
No economic data this morning. Today has that “summer Friday doldrums” feel to it, where half the Street will be on the L.I.E. by noon.
The next big economic event will probably be the bursting of the Chinese property bubble. Small investment trusts in China are already going belly-up, and that is usually the first step in the process. The Chinese government is trying to manage the process of deflating the bubble, but as we have seen elsewhere these things take on a life of their own and are more or less uncontrollable. The knock on effects will certainly be felt here, which I imagine will be most evident in lower inflation and lower commodity prices. It may also keep interest rates lower here than people are expecting as the Fed will struggle to maintain inflation at its 2% target.
I suspect luxury real estate markets where Chines money is prevalent – Vancouver, San Francisco, etc will certainly see more supply come on the market. In fact, this could be the trigger that bursts the Canadian real estate bubble. The Canadian banking system and housing finance system is generally more sound than ours in that lending standards are strict, and the Canadian government doesn’t play all the social engineering games the US does when it comes to housing.
Low inventory will support housing prices, and overall home sales for 2014 will be around 5.4 million units, according to Freddie Mac in their latest U.S. Economic and Housing Market Outlook. Here are the salient economic forecasts:
  • GDP will be 3% for 2H of 2014, and full year GDP will be 2% – 2.5%
  • House prices will grow 5% for the year
  • Home sales will drop to 5.4 million units
  • The 30 year fixed rate mortgage will be 5% a year from now
  • The 10 year will be above 3% by Q115.

Morning Report – FOMC data dump 6/19/14

Vital Statistics:


Last Change Percent
S&P Futures 1950.2 1.1 0.06%
Eurostoxx Index 3322.3 43.1 1.31%
Oil (WTI) 105.7 -0.2 -0.22%
LIBOR 0.23 -0.001 -0.61%
US Dollar Index (DXY) 80.25 -0.331 -0.41%
10 Year Govt Bond Yield 2.57% -0.01%
Current Coupon Ginnie Mae TBA 106.2 0.1
Current Coupon Fannie Mae TBA 105.5 0.0
BankRate 30 Year Fixed Rate Mortgage 4.26


Stocks and bonds are higher this morning after the FOMC meeting.
Some more economic data this am. Initial Jobless Claims came in at 312k, more or less in line with expectations. The Bloomberg Consumer Comfort Index rose to 37.1 from 35.5.
The FOMC meeting didn’t have any major bombshells, although the Fed took down its 2014 GDP forecast pretty aggressively, from a 2.9% estimate in March to a 2.2% estimate in June. The weather-related drag on the economy was worse than thought. Note that next week we will get the third and final revision to Q1 GDP, and the Street is forecasting it gets revised from -1% to -1.8%. Bonds rallied hard on the announcement, closing on their highs. In the press conference, Janet Yellen was asked about the latest CPI reading and she said that the CPI tends to be noisy. FWIW, the Fed uses a different inflation measure – Personal Consumption Expenditures for that very reason. The market took that statement to mean that the Fed is sanguine about inflation which gave bonds another excuse to rally. The forecast for the Fed Funds rate (Yellen’s dot graph) did not change from the March meeting. Overall, it was a “Goldilocks” type report, which gave stock and bond investors something to cheer about. Take a look at the chart below, and see how much the Fed has been overestimating future growth. This is their forecast for 2014 GDP growth going back to 2012.

Why does the Fed keep getting the GDP forecast wrong? It is probably because their models were built based on the typical garden variety post-Depression recession, which follows a Fed-induced recession process. The process is that the economy grows -> inflation picks up -> the Fed raises rates to quell inflation -> the economy begins to slow -> inventory builds -> people get laid off -> we go into a recession -> the inventory gets drawn down -> the laid off workers get re-hired -> and the economy recovers. The issue is that what happened in 2008 is that we had to deal with the fall out of a burst residential real estate market, and those happen every other generation. The recession is caused by a glut of bad debt, not a glut of inventory. And bad debt takes a lot longer to work off than a warehouse full of widgets.

There are 2 million “missing households” in the US – which represents pent up demand for new residences in the US. These are Millennials who are living with their parents or rooming together in an apartment. That represents 2 years of housing starts at the current pace. Rents are increasing, jobs are tough to get, and student debt is high. Fun fact – we haven’t been building this few homes since World War II, according to the NAHB. Let that sink in.

What does the declining labor force participation rate mean for the economy? There are two schools of thought going on here and this encapsulates the debate going on at the Fed. Does the long-term unemployed represent people who are essentially retired and will never return to the work force? If so, then there is less slack in the labor market that initially appears and therefore more stimulus will be inflationary. In essence that means the economy’s “speed limit” is lower than normal. Or is there a possibility that the long-term unemployed could return to the work force? If so, then more stimulus is not only necessary (though one can debate the efficacy of ZIRP on unemployment), but also will be non-inflationary. Note that we have been getting the worst of all worlds lately – increasing commodity prices, especially food prices combined with stagnant wage growth and slow job creation. While this is nothing like the stagflation of the late 70s, it still is painful.
FWIW, I personally think the long-term unemployed want (and need) to work and will enter the workforce as the economy improves. Employers have the luxury or choosing people with the wisdom of a 50 year old, skills of a 40 year old, the drive of a 30 year old, and the pay of a 20 year old. That won’t last forever. Also, the low capacity utilization rate means that inflation is a way’s off, and if anything increasing commodity prices are recessionary, not inflationary. They can only be truly inflationary if wages increase. Otherwise, people’s disposable incomes drop, spending decreases, and the economy slows, which lowers commodity prices. That said, I don’t think QE and ZIRP are having much of an effect on the economy, and the longer we stay with excess stimulus the harder normalization will be.

Morning Report – What to watch for with the FOMC this afternoon 6/18/14

Vital Statistics:


Last Change Percent
S&P Futures 1933.6 -0.2 -0.01%
Eurostoxx Index 3280.8 5.5 0.17%
Oil (WTI) 106.6 0.2 0.21%
LIBOR 0.231 0.000 0.00%
US Dollar Index (DXY) 80.54 -0.094 -0.12%
10 Year Govt Bond Yield 2.63% -0.02%
Current Coupon Ginnie Mae TBA 105.9 0.1
Current Coupon Fannie Mae TBA 105.2 0.1
BankRate 30 Year Fixed Rate Mortgage 4.26


Markets are flat ahead of the FOMC meeting. Bonds and MBS are up.


Mortgage Applications fell 9% last week as rates ticked up a hair. Purchases fell 4.7% while refis fell 12.7%. Refis dropped to 51.7% of all loans.


The FOMC decision is expected around 2:00 pm EST. Expect to see another reduction in asset purchases and no change in the Fed Funds rate. The focus will undoubtedly be Janet Yellen’s dot graph which shows the range of Fed Funds rate projections by the different FOMC members. Remember after the March FOMC meeting the bond market sold off on Janet Yellen’s “as soon as six months” comment, which was referring to the one lone dot sitting at the 1% line in 2014. Current forecasts for 2014 GDP are 2.8% – 3%, unemployment 6.1% to 6.3%, and inflation 1.5% to 1.6%. The Fed has consistently been overshooting on their GDP and unemployment estimates, while their projections of inflation have been more or less on target. So the big things to watch for are a) Janet’s dot graph, and b) revisions to economic forecasts.


Julian Castro, Obama’s nomination to head HUD believes that credit standards can be eased for FHA loans without jeopardizing FHA’s solvency. HUD is keen to increase access to credit, not only for minorities but also for the first time homebuyer, who has been the missing piece of the puzzle in the housing recovery.

Morning Report – Lousy housing starts report 6/17/14

Vital Statistics:


Last Change Percent
S&P Futures 1925.5 -3.7 -0.19%
Eurostoxx Index 3262.3 0.8 0.03%
Oil (WTI) 106.4 -0.5 -0.45%
LIBOR 0.231 0.000 0.17%
US Dollar Index (DXY) 80.62 0.149 0.19%
10 Year Govt Bond Yield 2.63% 0.03%
Current Coupon Ginnie Mae TBA 106.3 -0.3
Current Coupon Fannie Mae TBA 105.2 -0.1
BankRate 30 Year Fixed Rate Mortgage 4.2


Markets are lower this morning after housing starts disappoint. Bonds and MBS are down on the CPI data. The FOMC meeting starts today.
Consumer prices rose .4% in May versus expectations of a .2% rise. Ex food and energy, they were up .3%. On a year-over-year basis, prices are up 2%, which is more or less in line with the Fed’s targets.
Housing starts came in a touch over 1 million versus expectations of 1.03 million. Building permits were much weaker than expected, at 991k vs 1.05 million expected. We need housing construction for any sort of meaningful “recovery summer.” It is looking more and more like that isn’t going to happen. Permits fell off particularly hard in the notoriously volatile multi-fam segment.
Part of the issue with the housing market is the first time homebuyer. While the issues of student loan debt and a lousy job market are considered the main driver, there are myths that just refuse to die. According to research firm Zelman and Associates, people believe on average that lenders require a down payment of 11% to 15%. 39% or respondents believe you need a 15% down payment or more. The industry needs to do more to get the word out that there are programs like FHA and VA which require little to no down payment.
Yesterday, the IMF downgraded its estimate for 2014 US GDP growth to 2% and said that rates will stay at zero until late 2015. Right now, the Eurodollar futures are pegging the Fed Funds rate to be 75 basis points by the end of 2015. This forecast is lower than the Fed’s own forecast. Note the Fed will release new forecasts for unemployment, inflation, and GDP growth in the FOMC release tomorrow.
There has been a surprisingly low amount of grumbling from the Left over the Medtronic / Covidien transaction – where Medtronic is buying Ireland-based Covidien basically for the tax domicile. Corporate taxes in Ireland are 12%, versus the statutory tax rate of 35% plus state and local taxes which can push it to 40%. Ireland, like most other countries, has a territorial tax system where it only taxes income earned in its country. The U.S. taxes all overseas earnings once they are repatriated. Plus, obamacare slapped a 3.8% surtax on medical devices. It turns out that stocks that pursue these tax avoidance strategies outperform. Go figure.
Scratching your head about why the 10 year bond is rallying even as QE is being withdrawn and the economy is heating up? Wrap your head around this: Japanese consumer price inflation is rising at 3.4% per year. The yield on their 10 year bond? 73.5 basis points. The Bank of Japan has been buying JGBs in their own form of QE and has bought enough to effectively corner the market. When you talk about US bonds being in a bubble, they are nothing compared to Japan’s. File this one in the “market can stay irrational longer than you can remain solvent.” file. Right now markets all over the world are pricing in a 100% probability that central banks worldwide can stick the landing and return us to a normal interest rate environment without any major dislocations. If you are a bond investor, understand this: Central banks all over the world are attempting to create inflation. At some point they will succeed. Inflation won’t matter until it matters. And then it will be the only thing that matters.