Morning Report: Looks like the Fed tightening cycle is winding down.

Vital Statistics:


Last Change
S&P futures 2730.25 -14
Eurostoxx index 356.36 -1.74
Oil (WTI) 50.5 -0.96
10 year government bond yield 3.01%
30 year fixed rate mortgage 3.85%


Stocks are lower this morning on no major news. Bonds and MBS are up small.


The minutes from the November FOMC meeting were released yesterday, and they said nothing all that interesting. Bonds, which had been supported by Powell’s comments on Wednesday ticked up slightly. The media seemed to take the minutes as dovish, but there really wasn’t any sort of statement that jumped out.


Initial Jobless Claims increased by 10k to 234,000.


Personal incomes rose by 0.5% in October, and consumption rose by 0.6%. Those were extremely strong numbers, and support the idea that Q4 is going to be strong as well. It was also a bit of a Goldilocks report, with the personal consumption expenditures inflation reading sitting right at the Fed’s target rate, with the core rate (ex-food and energy) rising 1.8%.


The Fed Funds futures are pricing in a December hike as a pretty much a sure thing, and then have coalesced around the forecast that we get one more hike in 2019. In other words, we are in the late stages of this hiking cycle. Note that monetary policy acts with about a year’s lag, so we haven’t really begun to feel the hikes from this year. Below is the implied probability chart for the December 2019 Fed Funds futures.


fed funds futures


Pending Home Sales fell 2.6% in October, according to NAR. For those keeping score at home, this is the 10th straight drop, and demonstrates the issues of higher home prices and mortgage rates. All regions experienced declines, and the West was hit particularly hard as home prices have experienced double-digit increases for years. Something has to give in the real estate market – either prices have to stabilize, interest rates have to fall, or incomes have to rise. Given the personal income numbers and other anecdotal data, rising wages will probably end up squaring the circle.


Morning Report: New Home Sales drop

Vital Statistics:


Last Change
S&P futures 2932.25 -9
Eurostoxx index 357.94 0.56
Oil (WTI) 50.06 -0.15
10 year government bond yield 3.02%
30 year fixed rate mortgage 3.85%


Stocks are lower this morning on no real news. Bonds and MBS are up.


Jerome Powell spoke yesterday and said that rates are “just below” the neutral range. These comments pushed up bond prices (rates fell) and contributed to a rally in the stock market. He may have been walking back an earlier unscripted statement which said that the Fed had a “ways to go” before hitting neutral. He also said that there were no financial bubbles in the US and that the stock market was near its long term valuation average. This put a bid under stocks and other risk assets.


The Fed Funds futures didn’t really react all that much, however a consensus seems to be building that we are looking at a hike in December, and probably one more in 2019.


TBAs have spent the last couple of days catching up with the move lower in the bond market. MBS were up a good 6 ticks or so in a flat Treasury market. Note we will get the minutes from the November FOMC meeting at 2:00 pm EST. It probably should be a nonevent, but just be aware.


GDP came in at 3.5% for the third quarter. This was the second revision out of BEA and there were few changes. This is a deceleration from Q2’s torrid 4.2% growth rate. The PCE price index rose 1.5%, which is slower than the second quarter’s 2.0% pace, and below the Fed’s target or 2%.


GDP


Mortgage applications increased 5.5% last week as purchases rose 9% and refis rose 1%. Last week contained the Thanksgiving day holiday, so there were all sorts of adjustments to these numbers. Still it is encouraging.


New Home sales came in much weaker than expected, and we saw major, major declines in the Midwest and Northeast (which dropped around 20%). New Home Sales is a notoriously volatile number, and is often subject to major revisions. That said, there is no way to put a positive spin on that number – it was simply lousy.


new home sales


I Think Everyone but Thomas Piled on the Poor Guy

Click to access 17-1091_1bn2.pdf


This is 70+ pages of a good lawyer trying convince the Court to incorporate the federal right to claim a fine is excessive (as applied to a civil forfeiture).  The Indiana trial court and appellate intermediate court thought the fine [forfeiture] was excessive and ruled with the defendant, explicitly having decided under the US Constitution.  Indiana Supremes said that was not clearly laid out in any US Supreme Court case, and reversed.


So here we are, with a plausible argument before the Supreme Court and nobody even beginning to buy it.  Not RBG, nor Wise Latina, nor Roberts nor Alito.  Not Breyer, who was pretty funny.


Click, download, read, and enjoy.


And the entire Court, save for CT who was silent, just jumped all over the guy and made his life miserable.

And then the entire Court jumped all over the attorney general for Indiana.  All of them.  Except CT.


It is an entertaining read.


Morning Report: Dallas home prices and the lagging Northeast

Vital Statistics:


Last Change
S&P futures 2692.5 6
Eurostoxx index 358.13 0.76
Oil (WTI) 51.75 0.19
10 year government bond yield 3.06%
30 year fixed rate mortgage 4.89%


Stocks are higher this morning on as we await a speech from Jerome Powell. Bonds and MBS are flat.


Same store sales increased 7.7% last week according to Redbook. This would indicate that Black Friday was strong.


Consumer confidence from its multi-decade peak in October, driven by fears of of an economic slowdown. It is funny – the index asks people about their current state and then asks about their expectations for the future. The current state is at almost record highs while the future state is lower. This was the opposite for most of the Obama administration – the current state numbers were lousy, but people were optimistic for the future. Historically, consumer confidence was kind of an inverse gasoline price index, but the media is so heavily invested in talking down the “Orange Man Bad” economy that CNN damn near has an “impending recession” countdown monitor ticking in the lower right hand corner of the screen.


House prices rose 6.3% in the third quarter, according to the FHFA index. Prices were strongest in the Pacific Northwest / Mountain states. Prices were weakest in the Dakotas, Alaska, Louisiana, and Connecticut.


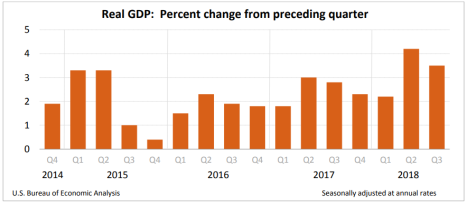
The Case-Shiller Home Price Index was flat MOM, and up 5.1% YOY. “Home prices plus data on house sales and construction confirm the slowdown in housing,” says David
M. Blitzer, Managing Director and Chairman of the Index Committee at S&P Dow Jones Indices.  “Sales of both new and existing single family homes peaked one year ago in November 2017. Sales of existing homes are down 9.3% from that peak. Housing starts are down 8.7% from November of last year. The National Association of Home Builders sentiment index dropped seven points to 60, its lowest level in two years. One factor contributing to the weaker housing market is the recent increase in mortgage rates. Currently the national average for a 30-year fixed rate loan is 4.9%, a full percentage
point higher than a year ago.”


Freddie Mac is out with their housing forecast for the next couple of years. Their view is that the market will adjust to the big slowdown we saw in 2018 and resume modest growth. That said, they see originations down slightly in 2019 and 2020, largely driven by a continued uptick in interest rates, but the worst of the decline is behind us. Purchases activity will increase, however the refi business will continue to decline. Interestingly, they see housing starts continue to lag historical levels despite the pent-up demand.


freddie outlook


The new 2019 conforming limits are out, and the new limit for SFR is 484,350, a 6.9% increase from 2018. Hi bal limits for SFR is 726,525. The multi-unit limits also increased by the same percentage.


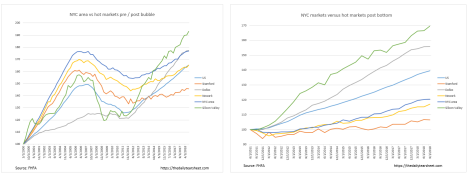
Yesterday, I mentioned an article in the Wall Street Journal about the Dallas home market and how it is the “canary in the coal mine” for the US real estate market. Builders are beginning to have to offer discounts / amenities in order to attract buyers, who are becoming more cautious following a rise in real estate markets. The Dallas market is interesting because Texas is more restrictive in terms of cash-out refinances. Take a look at the charts below. Dallas is the grey line. You can see they largely missed out a lot of the torrid growth during the bust years, but prices held up during the bust (they barely fell). However, take a look at the chart on the right, which shows the relative performance of several MSAs following the quarter when the US in general bottomed (late 2011). Dallas has well outperformed the US, and their appreciation is comparable to Silicon Valley. The Dallas market does indeed look toppy, and probably has more in common with the high flyers than the rest of the US. The median house price to income ratio is Dallas is 6, versus 4.4 for the rest of the US. Note as well how poorly the NYC metro area is doing. Fairfield County, CT (Stamford / Bridgeport), North Jersey (Newark) and Westchester (NYC area) are all just barely off the bottom. They have barely participated in the rebound seen in the rest of the country.

NYC MSAs

Morning Report: Home sizes fall

Vital Statistics:


Last Change
S&P futures 2664 -6
Eurostoxx index 357.22 -1.11
Oil (WTI) 51.69 0.06
10 year government bond yield 3.06%
30 year fixed rate mortgage 4.89%


Stocks are lower this morning on no real news. Bonds and MBS are flat.


We have a lot of Fed-speak today, with 4 different speeches. As we approach the December Fed meeting, the markets will hang on every word, looking for clues about 2019. The Fed funds futures are increasing their probability of a December hike, which is up to 80% compared to 66% a month ago.


Economic growth accelerated a touch in October, according to the Chicago Fed National Activity Index. The CFNAI is a meta-index of some 85 different statistics, and in October employment-related numbers (things like unemployment and initial jobless claims) were the drivers. Production-related statistics slowed a touch, but overall the economy is growing above trend.


Median home sizes are falling, as more and more builders focus on building starter homes. Home sizes rose during the housing bust as the luxury end of the market was about the only segment that was working. This trend was exacerbated by debt levels and employment uncertainty for the first time homebuyer. In addition, the Millennial generation tended to favor urban areas, and builders focused on apartment building. Now, we are seeing a glut of properties at the high end, and strong demand for starter homes as the first time homebuyer moves to the suburbs. Note that the latest existing home sales data had the first time homebuyer share at 31%. Historically, that number has been closer to 40%.


home sizes


Signs of things to come? The Dallas home market is cooling off, as affordability issues bite. The Dallas market is a little different than the typical US housing market – Texas has some limitations on cash-out refinances that meant it largely avoided the big boom / bust of the real estate bubble. Prices are 50% higher than they were in 2007, which is similar to MSAs like San Francisco. On the other hand, Dallas homebuyers are more likely to finance their purchases than the typical foreign cash buyer on the West Coast. Builders have a glut of inventory and are cutting prices / adding features to move properties.

Morning Report: Existing home sales rise

Vital Statistics:


Last Change
S&P futures 2660 31.25
Eurostoxx index 357.65 3.68
Oil (WTI) 50.97 0.55
10 year government bond yield 3.06%
30 year fixed rate mortgage 4.89%


Stocks are higher as investors return from the Thanksgiving holiday. Bonds and MBS are down.


Oil continues to plunge, falling 8% on Friday. Saudi Arabia continues to pump over 11MM barrels a day and there are worries of a supply glut. Oil has fallen about 33% since early October. Natural gas has given back some of its gains, but is still elevated on concerns of a cold winter in the South.


Existing home sales broke its six month losing streak, rising 1.4% in October, according to NAR. Sales rose 1.4% MOM to an annualized pace of 5.22 million. This is down over 5% YOY. The median home price was $255,100, up 3.8% YOY. The inventory situation continues to improve, but remains tight. There were 1.88 million homes for sale at the end of the month, which represents a 4.3 month supply.  There were only 3.9 month’s worth of homes a year ago.


The median home price to median income ratio now stands at 4.15x, an improvement from 4.4x, where it ended 2017. It is still above the historical range of 3.1 – 3.5 times, but below the peak levels of 4.8x. Note this ratio ignores the effect of interest rates, which affects affordability, but it does give a quick synopsis of home pricing.


Median House Price to Median Income Ratio


In other economic news, Mortgage applications were flat two weeks ago, with purchases rising 3% and refis falling 5%. Durable Goods orders fell 4.4% on weaker aircraft orders, and the Index of Leading Economic Indicators slowed in October. It is looking like the economy is moderating from its torrid mid-year pace.


Rising home prices means rising home equity, and over 80% of the refis last year were cash-outs. This is back towards bubble levels. This makes sense, because rate / term refis generally don’t make sense with rates at these levels. Cash-out refis are especially attractive if the borrower has credit card debt with rates in the teens.


cash out

Morning Report: Homebuilder sentiment sinks

Vital Statistics:


Last Change
S&P futures 2674 -22
Eurostoxx index 353.27 -1.53
Oil (WTI) 57.07 -0.13
10 year government bond yield 3.06%
30 year fixed rate mortgage 4.89%


Stocks are lower as yesterday’s sell-off continues through the global markets. Bonds and MBS are up.


Yesterday, the bond market rallied (rates fell) while we saw almost no movement in TBAs. What is going on? In technical terms, the basis increased. The basis is the difference in yields between the mortgage backed security and the risk free rate (measured by Treasuries). What drives the basis? Probably the biggest driver is interest rate volatility, which has been increasing. Mortgage Backed Securities are a bit different than normal bonds – they have negative convexity, which means they pay a little more than Treasuries with the same credit risk (i.e. none) but they have higher interest rate risk instead. MBS hate, hate, hate volatility in the bond markets, which is why you will sometimes see the 10 year yield down 3 or 4 basis points, excitedly run a scenario expecting to see an improvement, and get bupkis.


The issues in the market are beginning to affect the Fed Funds futures, which are now predicting a 68% chance of a hike in December. That estimate was closer to 80% a month ago.


Goldman believes growth will slow to the low 2% range for the first half of next year, and then drop to the high 1% range for second half. Their belief is that the Fed will succeed in slowing the economy, without sending it into a recession. The fiscal stimulus from tax cuts will be fading as well. FWIW, the experts and strategists consistently overestimated what growth would be in during the Obama administration and are consistently wrong to the downside since Trump became elected. If Goldman is right, expect the yield curve to flatten.


Homebuilder sentiment weakened in October, according to the NAHB / Wells Fargo housing sentiment index. Labor shortages and declining traffic are the culprits. The index fell from 68 to 60, which was the biggest drop in years. While an index level over 50 indicates favorable conditions, the sentiment that has driven the homebuilder XHB down 25% this year has finally begun to hit the builders themselves.


XHB chart


The sell-off in the stock market has been particularly harsh on the erstwhile darlings – the FAANG stocks. These stocks have entered a bear market (defined as 20% or more lower from the highs). Remember Bitcoin? About one year ago, it made its meteoric rise from roughly 7,000 to 20,000 in the span of 3 weeks. Where is it now? Under $4,500 and unable to get out of its own way.


bitcoin chart


Goldman believes growth will slow to the low 2% range for the first half of next year, and then drop to the high 1% range for second half. Their belief is that the Fed will succeed in slowing the economy, without sending it into a recession. The fiscal stimulus from tax cuts will be fading as well. FWIW, the experts and strategists consistently overestimated what growth would be in during the Obama administration and are consistently wrong to the downside since Trump became elected. If Goldman is right, expect the yield curve to flatten.


Morning Report: Quiet week coming up

Vital Statistics:


Last Change
S&P futures 2732 10.5
Eurostoxx index 357.96 0.25
Oil (WTI) 56.54 0.08
10 year government bond yield 3.08%
30 year fixed rate mortgage 4.89%


Stocks are lower this morning on no real news. Bonds and MBS are up.


We had a decent rally in the bond market last week, with the 10-year yield breaking 3.1% to the downside.


This should be a very quiet week coming up with the Thanksgiving Day holiday. The bond market will close early on Friday. There isn’t anything in the way of market-moving economic data, except for perhaps housing starts on Tuesday. We will also get existing home sales on Wednesday, along with the index of leading economic indicators. There will be some Fed-speak today, and the rest of the week is clear.


Industrial Production rose 0.1% in October, while Manufacturing production rose 0.3%. Capacity Utilization slipped a touch to 78.4%. Hurricane-related utility outages drove the lower IP number.


Larry Summers sees a 50/50 chance of a recession by 2020. “I think the risks if we have a recession are very, very serious so they [The Fed] need to bend over backward to avoid that,” he said. He thinks the Fed should probably err on the side of allowing inflation to build, and the fact it was so low for so long gives the Fed the breathing room to allow it to increase without unleashing an uncontrollable situation. He also thinks Trump should cut a deal with Democrats for an infrastructure spending package.


One strategist thinks it might be time to do some bottom-fishing in the homebuilding sector.

Morning Report: Inflation is tame, gas is not

Vital Statistics:


Last Change
S&P futures 2708 9.25
Eurostoxx index 360.56 -1.71
Oil (WTI) 56.32 0.07
10 year government bond yield 3.11%
30 year fixed rate mortgage 4.94%


Stocks are higher as oil stabilizes. Bonds and MBS are up. The 10 year is trading at 3.11%, quite the drop from the 3.27% levels of last week.


Inflation remains largely under control according to the Consumer Price index. The CPI in October rose 0.3% MOM and 2.5% YOY, right in line with street forecasts. Ex food and energy, it was up 0.2% MOM and 2.1% YOY.


A couple of trade groups wrote letters of support for Kathy Kraninger as head of the CFPB. The agency has been led by Mick Mulvaney, who also head OMB, as Acting Director. Kraninger is the supposed replacement. If she isn’t confirmed by the Senate in the lame duck session, the nomination returns to the President and Mick Mulvaney stays in charge for another 210 days. Kraninger promises to reform the CFPB in the same way Mick Mulvaney is, by ending “regulation by enforcement” and being more transparent about what the rules actually are.


It usually pays to keep tabs on markets unrelated to your own. While people have been focusing on the oil market, and the bear market in oil, we are seeing the opposite effect in natural gas. Oil has lost about 24% over the past month. Natural gas gained more than that this week. Seriously. Natural gas closed last Friday at around $3.70 a contract and closed yesterday at around $4.70 a contract. Many commodities, especially natgas, is extremely sensitive to weather forecasts – if you go to the New York Stock Exchange, you’ll see CNBC on the trading floor. If you go to the a commodity exchange like the Chicago Mercantile Exchange, they have on the Weather Channel. So, if you get a forecast for an extra-cold winter, the price can skyrocket. As the link above explains, while we are the Saudi Arabia of natural gas, supply is not the driver here, storage is. And if we have an unusually cold winter, the amount of gas in storage can fall to dangerously low levels, which means higher prices. There are rumors going around of a hedge fund that is short Natgas and in trouble, but who knows? Regardless, it is something to watch.


natural gas


Speaking of keeping tabs on other markets, watch the corporate bond markets. General Electric has issues. While everyone is aware of what is going on the stock price, the bonds are down about 15 points since early October. In bond market terms, for a household name like GE, that is a lot. Bonds trading in the low 80s aren’t necessarily distressed, but this is GE we’re talking about. If this snowballs, we should see a tightening of credit overall. It probably won’t affect the MBS market and mortgage pricing, but it will almost inevitably act as a drag on interest rates overall, and it could keep the Fed at bay.


Chart: Financial Stress Index:


financial stress index

Morning Report: Oil stumbles, and rates fall

Vital Statistics:


Last Change
S&P futures 2724 3
Eurostoxx index 362.85 -1.64
Oil (WTI) 55.92 0.23
10 year government bond yield 3.13%
30 year fixed rate mortgage 4.97%


Stocks are flattish this morning on no real news. Bonds and MBS are up.


Mortgage applications fell 3.2% last week as purchases fell 2.3% and refis fell 4.3%.  It has been a long, cold winter for the origination business over the past 6 quarters or so. You can look at the chart of the MBA mortgage application index to get an idea of just how tough it is out there right now.


MBA mortgage applications


Home prices rose 0.4% MOM and 5.6% YOY in September, according to the CoreLogic home price index. Prices rose the least in the hottest markets, as affordability issues bite. CoreLogic did a study of Millennial attitudes, and less than half think they would qualify for a mortgage, which is interesting given that FHA and GSE low down payment programs are targeted towards the first time homebuyer and are very forgiving in terms of FICO and downpayments. The industry can benefit from doing some education here.


30 day delinquencies fell 0.6 percentage points to 4% in August. The foreclosure rate fell 0.1% to 0.5%.  DQs are at the lowest level in 12 years. CoreLogic estimates that 1/3 of all MSAs are overvalued. Unfortunately, not all MSAs are created equal – there are a lot more people in the overvalued MSAs like San Francisco and Washington DC than there are in the some of the undervalued MSAs in the Midwest and Northeast. The overvalued MSAs will be most vulnerable to economic shocks.


Oil has been in a downward spiral, hitting the lowest levels in a year on fears of oversupply. It sounds like the hedge funds, CTAs and speccies have been long and wrong and are now capitulating. Note that commodity prices are often the canary in the coal mine with respect to global growth, and other cyclical commodities like lumber and copper are following suit.


Goldman sees unemployment falling to 3% within the next 18 months or so.  Goldman also sees another 125 basis points in Fed hikes during this cycle.