Morning Report: The SEC goes after Musk 9/28/18

Vital Statistics:

Last Change
S&P futures 2909 -10.5
Eurostoxx index 382 -4.4
Oil (WTI) 72.1 0.02
10 year government bond yield 3.03%
30 year fixed rate mortgage 4.74%

Stocks are lower this morning on overseas weakness. Bonds and MBS are up.

Personal incomes rose 0.3% in August, as did personal spending. The inflation numbers came in a little tamer than expected, with the headline number up 2.2% and the core number up 2%, right in line with the Fed’s target.

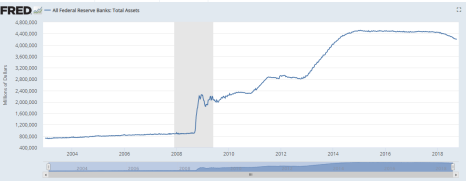
The Fed’s holding of Treasuries and MBS (relics of the QE and Operation Twist days) have dropped below $4 trillion. Total Assets at the Fed are still around $4.2 trillion, compared to pre-crisis levels below $1 trillion.

Fed assets

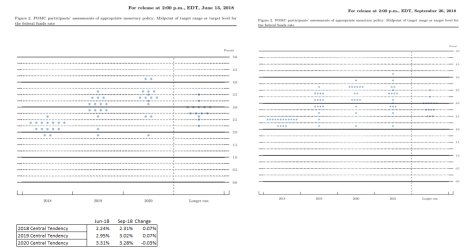
Jerome Powell suggested that the Fed is going to return to its more typical opaque posture with respect to the markets. In the aftermath of the crisis, the Fed became very open about its intentions and policies, and often seemed to follow the markets. This is a sensible posture when the economy is fragile, but the financial crisis is probably far enough in the rear view mirror that the Fed can start returning to normalcy. If Janet Yellen’s handholding of the markets was one extreme, Alan Greenspan’s Fed raising the Fed Funds rate 50 basis points at a surprise Saturday meeting was the other.

The SEC has is suing Elon Musk for issuing “false and misleading statements” and failing to notify regulators of material company changes relating to the ill-fated 420 tweet. On August 7, Elon tweeted “Am considering taking Tesla private at $420. Funding secured.” Tesla stock rallied on the announcement and then sold off as investors figured out it wasn’t as solid as it initially appeared. The SEC complaint is fascinating reading – the Board of Directors was blindsided by this, and I think it never dawned on Elon what the implications of that tweet would be. Essentially, he had initial talks with a large Middle Eastern investor who was interested in taking a strategic stake in Tesla. No price, percentage stake or other specifics were mentioned. Elon arrived at the $420 price by applying a 20% takeover premium to Tesla’s existing share price (which came to $419) and then rounded up to $420.

From the complaint: “According to Musk, he calculated the $420 price per share based on a 20% premium over that day’s closing share price because he thought 20% was a “standard premium” in going-private transactions. This calculation resulted in a price of $419, and Musk stated that he rounded the price up to $420 because he had recently learned about the number’s significance in marijuana culture and thought his girlfriend “would find it funny, which admittedly is not a great reason to pick a price.”

Elon never thought through any of the regulatory conditions, financing conditions, legal issues, how retail investors would have to be treated, etc before making the tweet, which was probably meant to stick it to short sellers. Tesla’s stock is down about 30% from its peak, and is a classic example of what happens when cult stocks stumble. As an aside, when company CEOs get into public wars with short sellers, that is generally not a bullish sign.

One of the remedies will be to ban Musk from ever serving on the Board of Directors of a public company, and he will certainly face civil suits from people who bought TSLA in the aftermath of the tweet, before the relevant information came out. Suffice it to say, this is one of the biggest corporate brain farts I have seen since Martha Stewart went to the big house (and lost about $1 billion in wealth from MSO’s stock decline) in order to prevent $60,000 in losses on IMCL stock.

In the aftermath of the US housing bubble, massive coordinated central bank easing has led to bubble conditions in six large cities: Hong Kong, Munich, Toronto, Vancouver, London and Amsterdam. Extreme overvaluation exists in Stockholm, Paris, San Francisco, Frankfurt and Sydney. Who knows when these bubbles will burst, but when they do, it will tend to pull rates lower, despite what the Fed is doing to short rates.

Morning Report: The Fed hikes rates as expected

Vital Statistics:


Last Change
S&P futures 2914 2.75
Eurostoxx index 385 0.05
Oil (WTI) 72.35 0.77
10 year government bond yield 3.06%
30 year fixed rate mortgage 4.79%


Stocks are higher after the Fed hiked rates yesterday. Bonds and MBS are flat.


As expected, the Fed raised the Fed Funds rate 25 basis points and removed the term “accomodative” from their statement. The decision was unanimous. The biggest change in the projection materials was an upward bump in GDP estimates for this year and next. The dot plot showed a slight uptick in forecasts (about 7 basis points for this year and next). The dot plot says we are probably looking at another hike in December, 2 more hikes in 2019, and one more in 2020. In other words, the heavy lifting of this tightening cycle has already been done. That said, monetary policy acts with a lag, so the 2018 hikes probably won’t be felt until mid-to-late 2019.  The 2s-10s spread fell to 22 basis points.


dot plot comparison jun vs. sep 2018


Bonds rallied (rates fell) on the FOMC announcement, which was probably attributable to the largely unchanged dot plot and the fact that rates rose so much leading into the FOMC announcement. Classic “buy the rumor, sell the fact” situation.


Durable goods increased 4.5%, driven by a big jump in aircraft orders. Ex-transportation, durable goods orders were roughly flat. Core Capital Goods (a proxy for business capital expenditures) fell 0.5%. Note the Fed mentioned strong business capital investment in the statement yesterday.


The final estimate for second quarter GDP was unchanged at 4.2%. The price index and consumption estimates were unchanged as well. This is the fastest pace in 4 years. Meanwhile, corporate profits for the second quarter were revised downward from 6.7% to 6.4%.


Initial Jobless claims inched up to 214k last week. Remember these are 50 year lows, and if you consider the fact that the population was 2/3 of current levels back then (along with a military draft) these numbers are astounding.


Pending Home Sales fell in August, according to NAR.  Lawrence Yun, NAR chief economist, says that low inventory continues to contribute to the housing market slowdown. “Pending home sales continued a slow drip downward, with the fourth month over month decline in the past five months,” he said.


“Contract signings also fell backward again last month, as declines in the West negatively impacted overall activity,” he said. “The greatest decline occurred in the West region where prices have shot up significantly, which clearly indicates that affordability is hindering buyers and those affordability issues come from lack of inventory, particularly in moderate price points.”

Morning Report: Fed Decision Day 9/26/18

Vital statistics:

Last Change
S&P futures 2924.75 3.5
Eurostoxx index 384.06 0.14
Oil (WTI) 71.82 -0.45
10 Year Government Bond Yield 3.08%
30 Year fixed rate mortgage 4.79%

Stocks are up small as we head into the FOMC decision. Bonds and MBS are flat.

The FOMC decision will be announced at 2:00 pm EST today. Be careful locking around that time. Given how much rates have increased ahead of the decision, the bond market is probably set up for a rally if the statement and / or supporting materials contain a dovish surprise. TBAs (and therefore mortgage rates) will be slower to respond to a sharp move in rates however and take a few days to fully react.

One thing to look for: whether the Fed considers its policy stance to be “accomodative.” There has been debate at the Fed whether that term is outdated. FWIW, sub 3% Fed Funds and a continuing bond purchase program sounds pretty accomodative to me, at least compared to Federal Reserve history.

Mortgage applications rose 3% last week. Both purchases and refis rose by the same amount. This is in spite of a big jump in rates, with the 30 year fixed conforming rate pushing 5%. 5/1 ARMS hit 4.22%, the highest since the survey began.

New home sales increased to an annualized pace of 629k in August, according to Census. This is an increase of 3.5% MOM and 12.7% YOY.  Inventory sits at 6.1 months’ worth.

Housing demand was unchanged in August, according to Redfin. You can see the effect rising rates and home prices have had on demand. Unfortunately the series doesn’t go back far enough to give much of a historical perspective, but it certainly indicates that the last year has had a marked negative effect on buyers. What will change that? Wage inflation.

housing demand

Mark Zandi looks at what expanding the housing trust fund might do to alleviate the supply / demand imbalance. He notes that most of the post-bubble building was at the high end price points (urban apartments and McMansions especially), and that entry-level / affordable housing has been neglected. Whether that is a case of NIMBY-ism or higher regulatory costs is open for debate.  Zandi estimates that increasing the housing trust fund could add an additional 200k units next year.

Morning Report: Home price appreciation is decelerating 9/25/18

Vital Statistics:

Last Change
S&P futures 2929.5 4
Eurostoxx index 383.66 1.52
Oil (WTI) 72.54 0.46
10 Year Government Bond Yield 3.09%
30 Year fixed rate mortgage 4.86%

Stocks are higher as the Fed begins their 2 day meeting. Bonds and MBS are down small.

Home prices rose 0.2% MOM  / 6.4% YOY according to the Case Shiller House Price Index. Prices are appreciating at a slower rate than last year (the second derivative has flipped to negative) and we are seeing less dispersion between geographic areas. The yellow highlighted portion of the graph shows the derivative flipping. The convergence is happening at both extremes – the red-hot Western markets are cooling a little, and some of the laggards in the Northeast and Midwest are picking up a little.

FHFA cumulative

Separately, the Case-Shiller HPI reported that prices rose 0.1% MOM / 5.9% YOY. The index showed the same slowdown that FHFA reported, although Las Vegas and Seattle are still super-strong.

JP Morgan is out with an aggressive call this morning: The Fed will raise rates every quarter through June 2019, taking the Fed Funds rate up to 3.0%. FWIW, the Fed funds futures are predicting only a 6% probability of that forecast, which would have to include an off-meeting hike or a 50 basis point hike at one of the meetings to play out. IMO, the Fed would need to see inflation accelerate meaningfully from here to do that, but the dot plot forecast tomorrow will tell a better picture.

The jump in the 10 year over the past month is setting up for a “buy the rumor, sell the fact” situation if the FOMC statement and dot plots are not sufficiently hawkish. In other words, if the statement is hawkish, the move up in rates has kind of already been made. And if it is dovish, we should see a retracement back down in rates.

Regardless of the increase in rates, the consumer remains ebullient, with the Consumer Confidence index increased in August and is sitting close to an 18 year high. Retailers are noticing as well, as same store sales rose 5.8%. This is despite a run up in gasoline prices. Q4 GDP should be well-supported by strong consumption numbers. It is surprising to see the jump in oil prices have pretty much no effect on confidence or spending. It could be an indication of rising wages.

Fascinating statistic: It can cost $750,000 to build a unit of affordable housing in California. Obviously it is hard to come up with a business model that supports it at those sort of pricing levels.

Morning Report: Builders cheap? 9/24/18

Vital Statistics:

Last Change
S&P futures 2928 -5.7
Eurostoxx index 383.56 -0.73
Oil (WTI) 71.89 1.11
10 Year Government Bond Yield 3.09%
30 Year fixed rate mortgage 4.87%

Stocks are lower this morning as oil rallies and China cancels trade talks. Bonds and MBS are down.

We have a lot of important economic data this week, including housing data, GDP, personal income / spending, and also the FOMC meeting. Given how much rates have jumped over the past month, the markets are set up well for a dovish surprise. In other words, if the Fed’s language isn’t as hawkish as people are fearing, we could see a snapback lower in rates. 2s-10s are trading at 26 bps, up from 21 a week ago.

Several strategists think the Fed is going to slow down the pace of normalization if they see the yield curve invert. While inverted yield curves don’t cause recessions, they tend to forecast them. Overseas weakness will play a part here, with Europe and China potentially slowing down. Of course this time is indeed different, as this is the first time the Fed has owned so much of the market. As I have said before, the signal to noise ratio of the yield curve’s slope is pretty lousy right now, and should be taken with a grain of salt.

Economic activity continued to hum along in August, according to the Chicago Fed National Activity Index. Production-related indicators increased, while employment was flat.

NAR notes that the housing market is becoming more balanced (with respect to leverage) between buyers and sellers, however it is still largely a seller’s market. Inventory is nowhere near a balanced level but, it is showing signs of at least bottoming out. 2015-2017 were years of high single-digit reductions in inventory. Affordability issues driven by rising rates and prices are drawing out more sellers, and making buyers more cautious. We are still nowhere near a balanced market, let alone a buyer’s market, but the imbalance may be reversing.

Ultimately, the key to balance is supply, as in homebuilding. Builders have been able to rely upon rising prices to drive growth, however affordability issues are going to make that a harder slog. Ultimately they will have to build more units to exhibit the growth that investors want to see. The age of homes in the US has been increasing for a long time.

age of homes

Note that JP Morgan just downgraded the whole sector, although valuations are close to peak cycle levels. P/E ratios for the big players are in the 8x – 12x range, which is typically where they bottom. The homebuilding sector is very cyclical, which means they will trade at single digit P/E ratios during the boom cycles, and 30x-50x ratios during down cycles. Generally speaking those valuation levels would normally be associated with housing starts in the 1.5 – 2.0 million unit range. This presents something of a conundrum: either investors are wrong about the homebuilders and they are cheap, or the return to normalcy in terms of housing starts is still years away on the horizon.

Wells announced that they will look to cut the workforce by 5% – 10% over the next 3 years, through attrition and displacements. The mortgage business wasn’t mentioned specifically in the press release. The bank is going through a big restructuring, and making an investment in technology, risk management and compliance. USAA announced job cuts as well. The industry is heading into the dreaded Q4 and Q1 and volumes / margins are lousy.

The FHFA is creating a new index that determines housing affordability. Current affordability indices generally use rules of thumb (house prices versus incomes) and generally create a static model of incomes. FHFA’s index will include a pro-forma analysis of what the mortgage will look like 3 years down the road. It is still a work in progress, but it will be interesting to see what an affordability plot looks like over time. Here is one that looks at the typical mortgage payment as a percentage of income (using 20% down and median home prices / incomes). While home prices are high relative to income, rates are still extremely low compared to the 90s, let alone the 80s.

mortgage payment as a percent of income

Morning Report: Existing home sales flat 9/20/18

Vital Statistics:

Last Change
S&P futures 2926 11.5
Eurostoxx index 382.7 2.72
Oil (WTI) 71.58 0.46
10 year government bond yield 3.09%
30 year fixed rate mortgage 4.86%

Stocks are higher this morning after China agreed to cut some tariffs. Bonds and MBS are getting slammed.

Bond yields are up 27 basis points over the past month. Not sure what is driving that (at least nothing specific), but it is a worldwide phenomenon. Bunds and JGBs have also been selling off, though not as dramatically. The Fed funds futures have become more hawkish over the same period, raising the probability of a Dec hike from 63% to 87%. This has certainly stopped the flood of hand-wringing stories in the business press about the flattening yield curve.

Initial Jobless Claims hit a 50 year low, and are within striking distance of the 200,000 level. Meanwhile, the Index of Leading Economic Indicators took a step back in August, rising 0.4% after July’s torrid 0.6% growth. Still strong numbers, however.

Consumer comfort rose to a 17 year high, according to the Bloomberg Consumer Comfort Index (highest since Jan 2001).

One reason why consumption has been strong is growing home equity, which rose almost a trillion YOY in the second quarter. This is an increase of 12.3%. The number of homes with negative equity fell by half a million to 2.2 million, or about 4.3% of all mortgaged homes. On average, the typical homeowner saw a $16,200 increase in housing wealth. Only 3 states: North Dakota, Connecticut, and Louisiana saw declines.

Existing home sales remained flat in August, according to NAR.  Lawrence Yun, NAR chief economist, says the decline in existing home sales appears to have hit a plateau with robust regional sales. “Strong gains in the Northeast and a moderate uptick in the Midwest helped to balance out any losses in the South and West, halting months of downward momentum,” he said. “With inventory stabilizing and modestly rising, buyers appear ready to step back into the market.” The median house price was $264,800, up 4.6% YOY. Inventory is still tight, at 4.1 month’s worth, and days on market ticked up slightly to 29 days. First time homebuyers accounted for 31% of sales. Historically, that number has been closer to 40%.

Closing rates jumped across the board to 71.7%, according to Ellie Mae’s Origination Insight Report. Average FICOs were 724, and average LTV was 79%. Both those numbers are more or less unchanged YOY. It typically took 43 days to close a loan.

When is the best time of year to buy a home? It depends. Prices do decline however during the winter, with purchases in January and February 8.5% cheaper than the peak summer months. Even in Autumn, they fall 3%. So, don’t get too depressed about your Z-scores during the winter months. It could be just seasonality.

Morning Report: Housing starts jump 9/19/18

Vital Statistics:

Last Change
S&P futures 2908.75 -3
Eurostoxx index 378.74 0
Oil (WTI) 69.94 0.09
10 year government bond yield 3.05%
30 year fixed rate mortgage 4.78%

Stocks are higher this morning on no real news. Bonds and MBS are down.

Mortgage applications increased last week despite a big uptick in rates. The overall index rose 1.6%, driven by a 4% increase in refis and a 0.3% increase in purchases. FWIW, I wonder if there is some sort of strange adjustment related to the Labor Day holiday going on. Rates hit a 7 year high, with the conforming 30 year fixed hitting 4.88%.  ARMs increased to 6.5% of all activity.

Housing starts rose to an annualized pace of 1.28 million in August, which is up over 9% on a MOM and YOY basis. Permits disappointed however, falling just under 6% on a MOM and YOY basis. Multi-fam (which is notoriously volatile) drove the decline in permits and the increase in starts. Single family permits were up about 6%. Geographically, the action was in the West and South, while the Northeast and Midwest were flat / barely up.

Housing starts will probably take a step back in the next few months as construction workers will be occupied rebuilding North Carolina.  Labor remains an issue for new home construction, but the tariff-driven spike in lumber prices is over, and futures are trading at 18 month lows.

lumber

Fannie Mae thinks growth has peaked for this cycle and that the second quarter’s torrid growth rate of 4.2% was artificially boosted by inventory build ahead of tariffs. This had the effect of borrowing growth from future quarters. In all fairness, they are probably correct – a 4.2% growth rate is so far above historical trend that it is almost by definition unsustainable. Housing continues to punch below its weight as affordability issues weigh on sentiment. Note that the number of people saying it is a good time to buy a house has hit the lowest level since the survey began 8 years ago. Blame rising rates and home price appreciation outstripping income growth.  FWIW, they are somewhat bearish on consumer spending going into the 4th quarter, which seems to defy a lot of data we are getting about retailer activity.

Insured losses form Hurricane Florence will be in the $1.7 to $4.6 billion range.

Morning Report: The Urban Institute examines manufactured housing 9/18/18

Vital Statistics:

Last Change
S&P futures 2899 3.25
Eurostoxx index 377.35 -0.96
Oil (WTI) 69.63 0.75
10 year government bond yield 3.01%
30 year fixed rate mortgage 4.68%

Stocks are higher after Trump’s proposed tariffs against China were smaller than expected. Bonds and MBS are flat.

Same store sales increased 5.4% last week, continuing a string of strong reports. Consumption data suggests that the fourth quarter is going to be strong, supported by the best holiday shopping season since the recession.

Builder sentiment was unchanged in September, according to the NAHB Housing Market Index. A lack of construction workers and higher construction costs are offsetting a strong seller’s market for new homes.

The credit markets for corporations with speculative credit remains robust. A Blackstone-led investor group raised $13.5 billion for a 55% stake in Reuters data business. Huge leveraged buyouts have been largely absent since the financial crisis, and the covenants are extremely borrower-friendly. Aside from the RMBS shenanigans of the 06-07 era, we saw a lot of reaching on leveraged buyout deals (LBO firms buying non-LBO friendly businesses like semis and retailers). In fact, the first indication of a problem in the credit markets in 06 was when the buy side refused to bite on the paper issued to fund the Alliance Boots transaction (an LBO of a British drug store chain). The banks got stuck with the inventory, and the rest is history.

With LBO credit widely available, you would think the private label MBS market would be coming back. So far, it is a shadow of its former self, with a number of issues (prepays, conflicts) preventing it from returning in any size. If it can’t do so in this environment, it almost makes you wonder if it ever will.

A UBS strategist is out with a bold call that the Fed will take a break after September and skip tightening at the December meeting. He believes that trade war fears will keep the Fed cautious, and will not be as inflationary as feared.

new study by the Urban Institute finds that contrary to popular belief, manufactured homes appreciate in value, although at a smaller rate (3.4% annually versus 3.8% for tradition homes). They suggest that geographical differences could explain the difference – mannies are concentrated in slower growth states and are underrepresented in pricey markets like the California. Currently the government only finances mannies when the land is part of the deal, and since this study uses the FHFA House Price Index, they are excluding structure-only chattel loans, which are something like 80% of the market. Note that mannies are overall more volatile that site-built homes, which means more risk for the lender all things being equal and therefore justifies the LLPAs.

A couple of economists think they have found a profitable trading strategy around the Fed. The idea is to buy or sell the market after the Fed makes a surprisingly dovish or hawkish monetary announcement and then unwind the trade 15 days later. The trade provides a higher return without increasing risk (higher Sharpe ratio). Something to think about ahead of next week’s FOMC announcement. If the dot plot comes out a bit more dovish than expected, supposedly you can make some money buying some SPYs and unwinding the trade mid-October. Full disclosure, not recommending you do that, just saying the study says it should work.


Morning Report: Hurricane Florence damage estimates 9/17/18

Vital Statistics:

Last Change
S&P futures 2908.5 -2.9
Eurostoxx index 377.97 0.1
Oil (WTI) 69.63 0.64
10 year government bond yield 3.01%
30 year fixed rate mortgage 4.68%

Stocks are flat on no real news. Bonds and MBS are down.

We should have a quiet week ahead with not much in the way of economic data and no Fed-speak. Bonds have been selling off ahead of the FOMC meeting next week. The Fed Funds futures continue to bump up the chance of a December hike, with the odds now over 80%.

While not market moving, we will get some housing data with builder sentiment tomorrow, housing starts on Wednesday, and existing home sales on Thursday.

Chinese stocks are trading at a 4 year low, partially driven by threats of a trade war. Declining stock markets typically put pressure on real estate prices (asset classes generally correlate on the downside), and China has a bubble on its hands. This has the potential to spill over to the US, at least in the higher priced West Coast markets, which should see an exit of Chinese speculative money. Separately, China is considering declining further trade talks.

Trade talks should continue on NAFTA this week. The biggest effect of NAFTA talks will be on housing costs, particularly lumber prices. Base metals have been weak on trade issues, which should dampen the inflation indices a bit.

Hurricane Florence didn’t pack the punch that people expected, but the flooding has been probably worse. CoreLogic estimates that the insured flood costs will be between 3 and 5 billion. For servicers, this will suck up some cash, as delinquencies will invariably spike and we will be heading into the holiday forbearance period just as these loans go 90 days down. Nonbank servicers should expect to see a spike in advance activity to go along with the normal seasonal spike.

Manufacturing growth moderated in September, according to the Empire State Manufacturing Survey. New Orders and employment were pretty much the same.

Realtor.com lists the top 10 suburbs in the US. Most are pretty pricey with respect to incomes, with median price / median income ratios ranging from 3.5x to 7.4x. To put that number in perspective, up until the late 90s, the median home price to median income ratio averaged about 3.2 – 3.6. It peaked at 4.8 in 2006. While median home price to median income ratios are an imperfect measure (since they ignore the effects of interest rates on affordability) they are still a relevant measure of how overpriced an area can be.

Retailers are struggling to hire temps heading into the holiday season. Some decided to start hiring this summer in order to beat the expected shortages, while others are offering higher pay and vacation time. Is the just-in-time employment model about to exhibit its weakness?

Goldman is forecasting growth to slow to 2.6% in 2019 and 1.6% in 2020. Many are now calling for a recession in 2020. The catalyst will be higher interest rates and end of the Trump tax cut “sugar high.” Perhaps the big investment in inventory build we are currently seeing will be the catalyst. Regardless, we don’t seem to have any asset bubbles in the US so we probably aren’t going to be looking at any sort of credit crunch. Overseas, there are issues (Canada, Scandinavia, Australia, China).

Morning Report: Initial Jobless Claims in perspective 9/13/18

Vital Statistics:

Last Change
S&P futures 2898 9.5
Eurostoxx index 378.25 1.14
Oil (WTI) 69.66 0.71
10 year government bond yield 2.95%
30 year fixed rate mortgage 4.64%

Stocks are higher this morning on positive trade comments out of China. Bonds and MBS are up.

The European Central bank left rates unchanged, which is helping bonds rally.

Inflation at the consumer level came in weaker than expected, with the Consumer Price Index rising 0.2% MOM and 2.7% YOY. Both numbers were 10 basis points below Street estimates. Ex-food and energy, they were up 0.1% / 2.2%, which pretty close to the Fed’s target. Falling health care costs, which make up about 10% of the index, helped offset increasing housing costs.

Increased housing costs are fueling a rise in home improvement activity. Both The Home Despot and Lowes are surging following results. Consumer Comfort rose for the first time in 5 weeks. Despite the run over the last month, the index is at highs not seen since 2000 (as are most of the consumer confidence / sentiment indices).

Initial Jobless Claims fell to 204,000, which is another 50 year record. When you take into account population growth, the number becomes even more dramatic:

Hurricane Florence has been downgraded to a Category 2 hurricane, but it is still expected to pack a wallop and dump a lot of rain. The hurricane is expected to dump 20-30 inches of rain over the area, which means flooding issues well inland. Servicers should expect to see an uptick in DQs going into the end of the year. Note that fewer households have flood insurance this time around. “Residents of these states are materially less prepared than they were in the past to deal with the financial consequences associated with major flooding events,” said Robert Hartwig, a risk-management and insurance professor at the University of South Carolina’s Darla Moore School of Business.

Ex-US Treasury Secretary Jack Lew is getting into the mortgage business, joining the advisory board of Blend, which is a consumer finance start-up that handles online mortgage applications for the GSEs and some of the larger banks.

Doug Kass made the great observation about the business media and the 10th anniversary of the financial crisis, recalling Mickey Mantle’s observation: “I didn’t know how easy the game of baseball was until I entered the broadcasting booth.”

HUD Secretary Ben Carson plans on doing more to remove zoning impediments to multifamily construction, though his approach will be different than the Obama Adminstration’s. He plans on using Community Development Block Grant funds to encourage changes in zoning. The Obama admin sued localities directly, with the most prominent case being Westchester County in New York. Westchester County ended up being able to fend off HUD for the most part, which kind of shows the futility of that exercise. Westchester should have been a lay-up. Separately, the House is looking at regulatory costs and multifamily construction, which supposedly account for 30% of the cost of multi fam homebuilding according to NAHB.

%d bloggers like this: