Morning Report: Mortgage applications fall 8/2/17

Vital Statistics:

Last Change
S&P Futures 2474.8 2.5
Eurostoxx Index 379.4 -0.9
Oil (WTI) 49.2 0.0
US dollar index 86.0 0.1
10 Year Govt Bond Yield 2.28%
Current Coupon Fannie Mae TBA 102.93
Current Coupon Ginnie Mae TBA 103.81
30 Year Fixed Rate Mortgage 3.95

Stocks are up this morning after Apple earnings beat estimates last night. Bonds and MBS are flat.

We will have some Fed-speak later this afternoon, but with the Fed on hold for the moment, it shouldn’t be market-moving.

Mortgage applications fell 2.8% last week as purchases fell 2% and refis fell 4%. Mortgage rates were more of less flat last week after the FOMC maintained interest rates and released a somewhat dovish statement.

The US economy added 178,000 jobs in July, according to the ADP payrolls number. The street is looking for 178,000 jobs in Friday’s employment situation report. Meanwhile, the Gallup jobs creation index ticked up to a record high.

CoreLogic’s mortgage fraud index ticked up to a new high. This is largely a reflection of 2 things: first, the index didn’t exist during the bubble days, and second it reflects the movement to a more purchase dominated market, which has more moving parts and opportunities for fraud. They note two schemes that are gaining traction right now. The first is the reverse occupancy scam, where a borrower claims they are buying a property to rent out. Future rental income is used to qualify the borrower. Once the loan is closed, the borrower moves in and doesn’t rent it out. The second is a pitch to investors in high cost areas to buy Rust Belt properties sight unseen and have the company manage them. Of course the buyers are paying inflated prices.

Multigenerational homes are making a comeback as kids either move back in with their parents or bring their aging parents into their homes. This is probably a temporary phenomenon driven by high real estate prices and a softish economy, however it is also cultural as multi-generational living is common in Asia. Don’t think the Waltons though. These new homes often have separate entrances, multiple kitchens and more than one master bedroom.

We might see a debt ceiling fight this fall, as Treasury has enough money to get through September. Treasury Secretary Steve Mnuchin is asking for a clean debt ceiling hike from Congress, but it probably won’t be that easy. This issue is probably one of the reasons that Sep Fed Funds futures are pricing in a negligible chance for a rate hike next month.

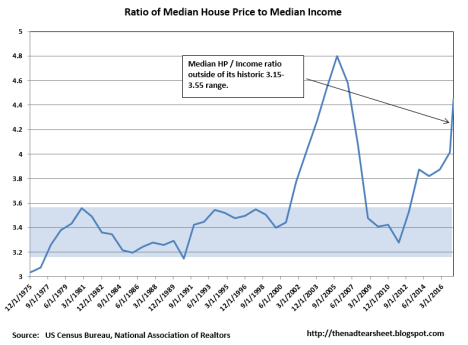
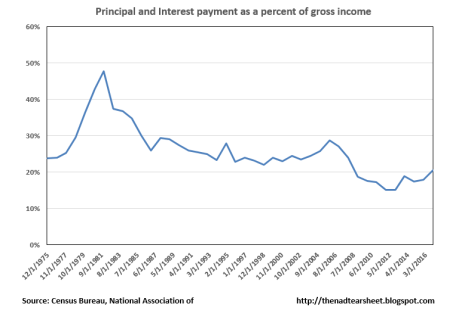
The MBA’s Dave Stevens weighs in on the state of the housing market. Biggest issue: tight credit and slow wage growth.

Morning Report: Irrational exuberance in the bond market? 8/1/17

Vital Statistics:

Last Change
S&P Futures 2475.5 7.5
Eurostoxx Index 380.1 2.2
Oil (WTI) 49.9 -0.3
US dollar index 85.9 0.1
10 Year Govt Bond Yield 2.32%
Current Coupon Fannie Mae TBA 102.93
Current Coupon Ginnie Mae TBA 103.81
30 Year Fixed Rate Mortgage 3.95

Stocks are higher this morning on overseas strength. Bonds and MBS are down a touch.

Personal income was flat in June, as a drop in interest / dividend income offset an increase in compensation. Inflation remains nowhere to be found as the PCE price index (the Fed’s preferred measure of inflation) was flat MOM and up 1.4% YOY. Ex-food and energy, the numbers ticked up 0.1%.

Home prices rose 1.1% in June and are up 6.7% YOY, according to the CoreLogic Home Price Index. Want to know how tight inventory is? Unsold inventory as a percentage of households stands at 1.9%, which is the lowest in 30 years.

Manufacturing strengthened slightly in June, according to the ISM and PMI manufacturing indices. Construction spending fell 1.3% in June as public construction spending fell. Residential construction was down 0.3% MOM, but is up 9% YOY.

Remember “irrational exhuberance?” That was Alan Greenspan’s warning to investors that there was a stock market bubble. Unfortunately for him, he issued the warning on 12/5/96, about 39 months before the stock market actually peaked. Well, he is back, warning of a bond market bubble. He is warning of an abrupt pop in the bond market, and a return to 1970s stagflation. Color me somewhat skeptical of the abrupt pop in the bond market argument. Below is a chart of interest rates going back to World War 1. As you can see, interest rate cycles are long. Aside from the disastrous Fed hike after the crash of 1929, rates stayed below 4% from 1924 to 1959.

100 years of interest rates

FWIW, the 1970s stagflation was largely due to the oil shocks combined with the guns and butter policies of the Johnson administration coming home to roost. The 1970s came after decades of economic strength, while today we are coming out of a decade of economic weakness. Housing starts averaged 1.75 million units per year for the entire 1970s. Since 2010, we have averaged about half that. During the 1970s, capacity utilization was running close to 83%. Since 2010, it has been 76%. Wage growth is stuck stubbornly at 2.5% growth, and there is still slack in the labor market. I just don’t see the conditions in place for a return to 1970s stagflation.

Financial regulators are working on a rewrite of the Volcker rule, which prohibits FDIC insured banks from proprietary trading. No one is sure what is actually being proposed – it may turn out that the re-write will merely provide some bright lines to separate prop trading from market-making. Between a drop in commissions and cloudy guidance over prop trading, market making has dried up, and liquidity is suffering in many markets as a result. Any changes will have to pass muster with a panoply of regulatory agencies, so this is going to take some time.

Morning Report: Freddie Mac explores what is driving low inventory 7/31/17

Vital Statistics:

Last Change
S&P Futures 2473.3 3.0
Eurostoxx Index 379.6 1.3
Oil (WTI) 49.7 0.0
US dollar index 86.2 -0.3
10 Year Govt Bond Yield 2.29%
Current Coupon Fannie Mae TBA 102.93
Current Coupon Ginnie Mae TBA 103.81
30 Year Fixed Rate Mortgage 3.95

Stocks are flat this morning on no real news. Bonds and MBS are unchanged.

Pending Home Sales rose 1.5% in June, according to NAR. On a YOY basis, the index is up half a percent. Housing inventory is down 7% YOY.

Freddie Mac explores the issue of tight inventory and asks why builders aren’t adding much supply. The issue largely concerns labor, especially skilled labor. The bust laid off about 1.5 million construction employees, who ended up finding new jobs in different sectors of the economy (especially the energy sector). These people are probably not coming back to the construction sector without some sort of catalyst. Second, young people don’t seem all that interested in working construction, and the ones that are cannot pass a drug test. Tighter immigration enforcement and the economy in general have led to a drop in immigrants, who have historically been about 25% of the construction industry. Land costs as a percent of new home costs have been rising as well, which is creating pressure on margins. Land use regulations are also stretching out the time it takes to work through the permitting process.

Speaking of drug tests, a factory owner in Ohio says they have plenty of jobs, but can’t find people who can pass the drug test. 40% of their applicants cannot pass a drug test.

The Fed plans to unveil soon its recommendation to replace LIBOR. LIBOR had been the benchmark interest rate for all sorts of variable rate products for decades, but had one fatal flaw: it was set based on self-reports from a consortium of investment banks. The problem is that the bank could say it was pricing LIBOR at a rate that it wasn’t prepared to actually honor. Since banks have all sorts of products that are pegged to LIBOR, they have an incentive to manipulate the measure in order to get the most favorable mark for their own positions. The group is recommending a broad treasury financing rate based on Treasury repos. This rate will be based on what people are actually paying for financing in the markets, not a survey. There are something lie, $330 trillion of derivatives and loans (everything from mortgages to student loans) that are pegged to LIBOR.

New documents bolster the case for Fannie Mae shareholders that the government lied when began to sweep all of Fannie’s profits. The cover story was that Fannie was in a “death spiral” and this was necessary to hasten the wind-down of their business. The documents show Tim Geithner saying that Fannie will be earning strong revenues and can support the 10% dividend for years into the future. Does that mean shareholders will get anything? They probably shouldn’t, as the government maintained a 20% public minority stake only so it didn’t have to consolidate Fannie’s debt on its own balance sheet. Under any sort of bankruptcy scenario shareholders would have been wiped out. The stock is a litigation lottery ticket.

Morning Report: More on housing affordability 7/28/17

Vital Statistics:

Last Change
S&P Futures 2465.3 -7.0
Eurostoxx Index 378.7 -3.6
Oil (WTI) 49.1 0.0
US dollar index 86.2 -0.3
10 Year Govt Bond Yield 2.30%
Current Coupon Fannie Mae TBA 102.93
Current Coupon Ginnie Mae TBA 103.81
30 Year Fixed Rate Mortgage 3.95

Stocks are lower this morning on overseas weakness. Bonds and MBS are flat.

The advance estimate for second quarter GDP came in at 2.6%, in line with expectations. This is an increase from the first quarter estimate of 1.2%. Personal consumption increased 2.8%, while the price index increased 1% while the savings rate inched down. This should give the Fed the room to maintain interest rates at this level if they choose to do so.

The employment cost index rose 0.5% in the second quarter and is up 2.2% YOY. Wages and salaries increased 0.5% and benefit costs increased 0.6%.

Consumer sentiment edged up in July, according to the University of Michigan survey.

I had some questions yesterday regarding LIBOR and what happens to ARMs once it is gone in 2021? The short answer is that nobody knows for sure. The US will probably migrate to some other repo rate to set short term rates. Perhaps once LIBOR goes away, there will be a LIBOR reference rate which is pegged to whatever short term rate is being used and will move at a constant spread to that rate.

I was discussing housing affordability a couple days ago and talked about mortgage payments as a function of income over time. I showed that the post bubble days hit 40 year lows (at least) and that we are still well below historical levels. The issue with that analysis is that it ignores the tax effects of the mortgage interest deduction, which really mattered in the late 70s / early 80s when tax rates and interest rates were much higher. Up until the mid 80s, the marginal tax rate for the median income was between 22% and 24%. It has been 15% ever since. Also, when interest rates were much higher, the vast majority of your payments for the first few years went to interest, not principal – in fact when mortgage rates were 17%, 99% of your first year’s payment went to interest. Today, that number is much lower, and even ticked below 70% in 2012. Check out the chart below:

mortgage interest

That chart also speaks to how much quicker one can build equity simply by paying their mortgage on time. Back in the 70s / 80s, you were probably lucky to have enough home price appreciation and principal paid to cover your closing costs if you moved after a few years. Today, you have both strong home price appreciation and a higher principal payment percentage. This helps emphasize how real estate is a great way to build wealth.

Here is the chart comparing the gross percentage of income that a mortgage payment consumed over time and also the tax effected percentage: As you can see, it is pretty linear, and we are still in a great position now compared to 30 years ago.

mortgage payment as a percent of income

Morning Report: Fed makes no changes to policy 7/27/17

Vital Statistics:

Last Change
S&P Futures 2478.0 5.0
Eurostoxx Index 382.8 0.0
Oil (WTI) 48.4 -0.3
US dollar index 86.3 0.1
10 Year Govt Bond Yield 2.30%
Current Coupon Fannie Mae TBA 102.93
Current Coupon Ginnie Mae TBA 103.81
30 Year Fixed Rate Mortgage 3.95

Stocks are higher after the Fed maintained existing policy yesterday. Bonds and MBS are flat.

As expected, the Fed kept the Fed Funds rate the same. The statement was almost identical to the June statement. The September Fed Funds futures went to a 100% probability of no hike, and the December futures went to a 51% chance of no hike. The Fed said balance sheet reduction will begin “relatively soon.” The consensus seems to be that “relatively soon” means September. The Fed Funds futures are hinting that as well, by going to a 0% probability of a rate hike, which means they are betting September will the meeting where tapering is announced. One complicating factor will be the debt ceiling hike, which will be happening around that time. If we get a stand-off, we might see the Fed punt until the December meeting.

June Durable Goods orders were up big on aircraft. The headline number was an increase of 6.5% MOM and 16% YOY. Ex-transportation, they were up 0.2% MOM and 6.8% YOY. Core capital goods orders (a proxy for business capital expenditures) fell 0.1% and are up 5.6% YOY.

Initial Jobless Claims ticked up to 244k, while the Chicago Fed National Activity Index rebounded to .13.

The UK banking regulator has decided to kill LIBOR by phasing it out by 2021.

Freddie Mac changed its guidelines on Home Possible Loans. No gift money until 3% down.

Morning Report: Homebuilders report strong order growth 7/26/17

Vital Statistics:

Last Change
S&P Futures 2479.0 5.0
Eurostoxx Index 382.4 1.6
Oil (WTI) 48.4 0.5
US dollar index 86.7 0.0
10 Year Govt Bond Yield 2.32%
Current Coupon Fannie Mae TBA 102.93
Current Coupon Ginnie Mae TBA 103.81
30 Year Fixed Rate Mortgage 3.95

Stocks are higher this morning as oil rallies. Bonds and MBS are flat.

The FOMC decision is due out at 2:00 pm EST. Be careful locking loans around that time. No change in interest rates is expected, however the language in the statement always has the potential to move markets. You are starting to see some movement in the Dec Fed Funds futures, with the market currently handicapping a 48% chance of no change, 47% of 25 bps and a 5% chance of 50 bps between now and then. Sep futures are stuck at 92% chance of no change and an 8% chance of a 25 basis point hike.

Mortgage applications rose 0.4% last week as purchases fell 2% and refis increased 3%. Mortgage rates in general fell about 5 basis points during the week. ARM share increased to 6.8%.

Despite all the consternation in DC, consumer confidence continues to rise. The Consumer Confidence index rose to 121, largely on the strength of the jobs market. The number of people who think jobs are “hard to get” fell to 18%, while those that think jobs are “plentiful” rose to 34%.

New Home Sales ticked up to 610k in June, which is up 9% on a YOY basis.

Homebuilder Pulte reported earnings yesterday. Orders were up 12%, and backlog was up 19%. They did warn on gross margins, as wildfires in Canada are pushing up framing lumber prices. Pulte has a national footprint, but it is big in the Midwest, which shows that things are picking up in that part of the country.

D.R. Horton reported earnings as well. Orders increased 13% and backlog increased 5%. Tight labor markets are affecting margins. D.R. Horton is more exposed to the South and Southwest, and therefore will be more sensitive to what is going on in the oil patch.

Since the election, the XHB (S&P Homebuilder ETF) has been on a tear, increasing 23% since the election.

The House is expected to use the Congressional Review Act to overturn the CFPB’s recent rule on mandatory arbitration. It is expected to fall 100% on partisan lines. In the Senate, all Democrats are expected to vote against overturning it, and there are a few Republicans who are undecided.

Interesting stat on GNMA servicing portfolios since 2014. Down 25% at major banks, up 15% at smaller banks, doubled at non-banks. GNMA servicing rights have been weighed down by the costs of FHA delinquencies as well as higher than expected prepayment speeds due to the VA IRRL program. The government recently changed the rules for quick IRRL refis, but servicing values have yet to rebound.

Morning Report: House prices hit new highs. Are we in a bubble? 7/25/17

Vital Statistics:

Last Change
S&P Futures 2475.0 7.0
Eurostoxx Index 381.8 2.5
Oil (WTI) 47.2 0.9
US dollar index 86.4 -0.1
10 Year Govt Bond Yield 2.28%
Current Coupon Fannie Mae TBA 102.93
Current Coupon Ginnie Mae TBA 103.81
30 Year Fixed Rate Mortgage 3.95

Stocks are higher this morning as the Fed begins their 2 day FOMC meeting. Bonds and MBS are down.

House prices rose 0.4% MOM in May, according to the FHFA House Price Index. They are up 6.9% YOY. Home price appreciation is still red-hot on the West Coast, however some of the laggards (Midwest and East Coast) are starting to pick up steam. Meanwhile, the Case-Shiller Home Price Index rose .1% in May and is up 5.7% YOY. Why the difference? The FHFA House Price index only looks at homes with a conforming mortgage, which eliminates the distressed all-cash extremes on the low end, and jumbos on the high end. Certainly out here in the Northeast, the luxury end of the market (aside from trophy properties in the Hamptons and Manhattan) is deader than Elvis. Note that we have more than recouped the losses from the go-go days, at least according to the FHFA House Price Index.

FHFA House Price Index

I wanted to spend a little more time discussing housing affordability. If you look at the median house price to median income ratio, we are approaching the highs during the bubble years. We are currently at around 4.4x and historically, that number has been between 3.2 and 3.6x, meaning that house prices are stretched compared to incomes. It makes sense that house prices should be related to incomes in terms of measuring affordability, and also vulnerability do downdrafts.

Median House Price to Median Income Ratio

However is “median house price” the correct metric to use when determining affordability? It has one major flaw: it ignores interest rates. As car dealerships know, the sticker price is not the metric to sell a car: it is the monthly payment. Can’t afford a 30,000 car? Well, what if we go from a 6 year loan to an 8 year loan? Can you now afford that payment? Mortgages aren’t really that much different. So, to look at it from that angle, I plotted the typical mortgage payment (80 LTV conforming loan) on the median house and calculated what percentage of median income that payment turned out to be. And when you look at it that way, affordability it still pretty decent, at least compared to historical numbers. The reason why? Interest rates. For almost a decade, mortgage rates were double digits, and that equates to a much bigger payment for the same “median house.” It turns out that mortgage payments as a percentage of income are much lower than what they historically have been.

mortgage payment as a percent of income

Now, the one complicating factor is the mortgage interest deduction, which makes housing in the 80s look less affordable than it really was. Taxes were higher, and interest as a percentage of the P&I payment was higher, so the differences are somewhat exaggerated. However, it does appear that buying a house is not as “unaffordable” as the median house price to median income ratio implies. Just remember these graphs when you hear people discussing how high real estate prices are and that we are in another bubble. We aren’t.

Morning Report: Existing Home Sales fall 7/24/17

Vital Statistics:

Last Change
S&P Futures 2468.0 -1.3
Eurostoxx Index 378.9 -1.3
Oil (WTI) 46.1 0.3
US dollar index 86.4 -0.1
10 Year Govt Bond Yield 2.24%
Current Coupon Fannie Mae TBA 103.31
Current Coupon Ginnie Mae TBA 104.375
30 Year Fixed Rate Mortgage 3.96

Stocks are lower this morning as earnings continue to come in. Bonds and MBS are flat.

The big event this week will be the FOMC meeting on Tuesday and Wednesday. No change in rates is expected, however the language in the statement always has the potential to move markets, so just be aware. We will have some important data, especially in housing, as well as GDP this Friday. No data this morning, however.

Affordable housing advocates will be spending the week marching and discussing the need for more affordable housing, as well as advocating for no cuts the HUD’s budget. The biggest proposed cut to HUD involves the Community Development Block Grant program, which famously funds Meals on Wheels, but is in reality just funds pet projects in various districts, especially in the counties surrounding DC.

The Fed will probably discuss tapering this week, which concerns letting its portfolio of bonds bought during quantitative easing to mature. The European Central Bank is also contemplating doing something similar. While there is concern that tapering will push up longer-term interest rates, these are probably overblown. Certainly QE did not affect mortgage backed spreads much at all, and tapering will be a fraction of what full-blown QE was.

Existing Home Sales dropped 1.8% in June as tight inventory is driving up prices and affecting affordability. The median home price increased 6.5% to $263,800. This puts the median house price to median income ratio at about 4.4x, which is elevated. That ratio peaked at 4.8x during the bubble, and fell to 3.3x during the bust years. Historically that number has been in the 3.2x-3.6x range, although you have to correct for interest rates, which does affect affordability. You can see the index of home prices versus incomes diverging again.

Total housing inventory fell to 1.96 million units, which represents a 4.3 month supply. A balanced market is usually around 6 month’s worth. Affordability concerns also hurt the first time homebuyer, who fell to 32% of sales, down from a 33% the prior month. All cash sales were down to 18% from 22% the year prior. The REO to rental trade might be driving that as professional investors stop buying. In fact, pros should be looking at selling – prices are elevated.

Morning Report: Wages increasing at the low end of the scale 7/21/17

Vital Statistics:

Last Change
S&P Futures 2470.8 -0.8
Eurostoxx Index 382.4 -1.6
Oil (WTI) 46.6 -0.4
US dollar index 86.7 0.2
10 Year Govt Bond Yield 2.25%
Current Coupon Fannie Mae TBA 103.31
Current Coupon Ginnie Mae TBA 104.375
30 Year Fixed Rate Mortgage 3.96

Stocks are flat this morning on another Summer Friday. Bonds and MBS are flat.

Should be a dull day as much of the mortgage business is at the Western Secondary conference, there is no data or Fed-Speak, and the rest of the Street will be on the LIE by noon.

What states still have the highest foreclosure issues? New Jersey is the worst, with 1% of all homes in some state of foreclosure. They are followed by DE. MD, IL, CT, NV, FL, SC, OH, and NM. Note there isn’t a lot of overlap between these areas and the best places to start a business.

Republicans in Congress plan to use the Congressional Review Act to overturn the Obama-era CFPB ruling that eliminates mandatory arbitration. The left wanted to overturn mandatory arbitration in order to make it easier to use class-action lawsuits to attack what it considers bad corporate behavior. The right worries that it will restrict credit, and amount to nothing more than a sop to the trial lawyers lobby.

Are we beginning to see the stirrings of wage inflation” Certainly at the low end of the wage scale we are. We are also starting to see wage inflation at the high end, where there are shortages of skilled labor. The middle is still lumbering along at 2.5% wage growth or so – better than inflation, but not all that satisfying. Especially since rental costs are outpacing inflation due to tightness in the real estate market. I have said this before: getting housing starts up fixed two major problems: lack of middle class jobs and a tight real estate market. Both would go a long way towards making the economy feel better.

Further to the above, Axios has a cool moving graph that demonstrates the malaise in the jobs market over the past decade. It plots the number of jobs on the vertical axis and wages on the horizontal axis. You can see in some professions where both the number and the wages have been falling.

Morning Report: What is the shape of the yield curve telling us? 7/20/17

Vital Statistics:

Last Change
S&P Futures 2475.8 4.3
Eurostoxx Index 387.3 1.8
Oil (WTI) 47.4 0.3
US dollar index 87.2 0.2
10 Year Govt Bond Yield 2.26%
Current Coupon Fannie Mae TBA 103.31
Current Coupon Ginnie Mae TBA 104.375
30 Year Fixed Rate Mortgage 3.96

Stocks are up this morning as global central banks remain easy. Bonds and MBS are up small.

The Index of Leading Economic Indicators jumped 0.6% in June, which is forecasting an acceleration in the economy going forward.

Initial Jobless claims fell to 233k, which is a 9 week low. The last time we were at similar levels was the early 1970s, when the Vietnam War was still raging. I have plotted initial jobless claims (left axis) versus wage inflation (right axis). You can see the inverse correlation, and it also suggests that with claims this low, we should be seeing wage inflation. Of course inflation has an influence as well, and the late 60s / 70s were characterized by inflation. However, pressures seem to be building, and we are seeing wage inflation at the lowest end of the spectrum – low wage workers.

initial jobless claims vs wage inflation

Bill Gross looks at the shape of the yield curve and warns investors not to read too much into it, since the curve is being manipulated by central bankers worldwide. The chart below shows the difference in yield between the 10 year bond and the 3 month T-bill. That difference has historically been somewhat predictive of recessions, especially when it has inverted. While the current spread is nowhere near zero, the trend is certainly heading that way. Does that mean a recession is imminent? His point is that we are really in an apples-to-oranges comparison with QE. Global central bank buying of sovereign debt is pushing that spread downward, and the relevant question is where would the yield curve be without the Fed’s (and other global central banks’) buying?

yield curve

He does make the point that Corporate America is more leveraged than before, however with rates so low, the debt service (actual interest paid) is much less than it was historically. You see that in households too. Total debt has risen past the old highs, however the debt service (interest paid as a percent of disposable income) is close to the lows.

The NYC luxury real estate market is soft, and many luxury sellers in Greenwich, CT are pulling the plug on sales. Of the homes in this market ($4.5 million+) days on market was 319, up by over 100 days. Some sellers have had to cut their price by 60% to entice a buyer. FWIW, I see very little building in this area of the country – only a handful of spec homes have been built, and they haven’t sold yet.