

I talk about the Fed, interest rates, and real estate.
Filed under: Economy | Leave a comment »
I talk about the Fed, interest rates, and real estate.
Filed under: Economy | Leave a comment »
Vital Statistics:
| Last | Change | Percent | |
| S&P Futures | 1607.5 | 8.2 | 0.51% |
| Eurostoxx Index | 2618.1 | 15.5 | 0.60% |
| Oil (WTI) | 97.87 | 1.3 | 1.36% |
| LIBOR | 0.273 | 0.000 | 0.00% |
| US Dollar Index (DXY) | 83.16 | 0.022 | 0.03% |
| 10 Year Govt Bond Yield | 2.53% | 0.04% | |
| Current Coupon Ginnie Mae TBA | 102.3 | -0.2 | |
| Current Coupon Fannie Mae TBA | 101.3 | -0.2 | |
| RPX Composite Real Estate Index | 205.3 | -0.2 | |
| BankRate 30 Year Fixed Rate Mortgage | 4.39 |
Markets are higher on no real news. The Markit US Purchasing Managers Index came in a little lower than expected. Later this morning we will get construction spending and the ISM manufacturing. ISM could be market moving. Bonds and MBS are down.
This week is relatively data-light, with the 4th of July holiday in the middle. The highlight of the week will be the jobs report on Friday.
A record $80 billion was pulled out of bond funds and bond ETF funds in the month of June, according to Trim Tabs. This record outflow is also based on people who follow the news closely. Q2 statements are coming out soon and a lot of people who don’t follow their investments closely may be in for a shock. Which means we could face another deluge of selling.
Delinquencies are falling again, with serious delinquencies dropping to 2.83% in the month of May, according to Fannie Mae’s monthly summary. Serious DQs were 3.57% a year ago. Separately, Citi paid just under $1 billion to settle buyback claims on mortgages originated from 2000 to 2012.
I will be on Capital Markets Today later this afternoon discussing the latest from the bond markets
Filed under: Morning Report | 29 Comments »
Vital Statistics:
| Last | Change | Percent | |
| S&P Futures | 1603.2 | -3.4 | -0.21% |
| Eurostoxx Index | 2596.7 | -23.2 | -0.88% |
| Oil (WTI) | 97.22 | 0.2 | 0.18% |
| LIBOR | 0.273 | -0.001 | -0.33% |
| US Dollar Index (DXY) | 82.83 | -0.075 | -0.09% |
| 10 Year Govt Bond Yield | 2.52% | 0.05% | |
| Current Coupon Ginnie Mae TBA | 102.1 | -0.5 | |
| Current Coupon Fannie Mae TBA | 101.1 | -0.4 | |
| RPX Composite Real Estate Index | 205.5 | -0.2 | |
| BankRate 30 Year Fixed Rate Mortgage | 4.38 |
Filed under: Morning Report | 48 Comments »
Vital Statistics:
| Last | Change | Percent | |
| S&P Futures | 1604.5 | 9.0 | 0.56% |
| Eurostoxx Index | 2604.7 | 1.9 | 0.07% |
| Oil (WTI) | 95.87 | 0.4 | 0.39% |
| LIBOR | 0.274 | -0.002 | -0.58% |
| US Dollar Index (DXY) | 82.85 | -0.128 | -0.15% |
| 10 Year Govt Bond Yield | 2.49% | -0.05% | |
| Current Coupon Ginnie Mae TBA | 101.7 | 0.3 | |
| Current Coupon Fannie Mae TBA | 101.1 | 0.4 | |
| RPX Composite Real Estate Index | 205.6 | 0.2 | |
| BankRate 30 Year Fixed Rate Mortgage | 4.57 |
Filed under: Morning Report | 56 Comments »
Morning Report
| Last | Change | Percent | |
| S&P Futures | 1587.9 | 6.5 | 0.41% |
| Eurostoxx Index | 2599.1 | 55.8 | 2.19% |
| Oil (WTI) | 94.88 | -0.4 | -0.46% |
| LIBOR | 0.276 | -0.001 | -0.18% |
| US Dollar Index (DXY) | 82.73 | 0.144 | 0.17% |
| 10 Year Govt Bond Yield | 2.53% | -0.08% | |
| Current Coupon Ginnie Mae TBA | 101.2 | 0.7 | |
| Current Coupon Fannie Mae TBA | 100.7 | 0.7 | |
| RPX Composite Real Estate Index | 205.5 | 0.2 | |
| BankRate 30 Year Fixed Rate Mortgage | 4.58 |

Filed under: Morning Report | 40 Comments »
Vital Statistics:
|
Last |
Change |
Percent |
|
|
S&P Futures |
1576.3 |
10.1 |
0.64% |
|
Eurostoxx Index |
2546.0 |
34.2 |
1.36% |
|
Oil (WTI) |
95.53 |
0.3 |
0.37% |
|
LIBOR |
0.276 |
-0.001 |
-0.23% |
|
US Dollar Index (DXY) |
82.29 |
-0.137 |
-0.17% |
|
10 Year Govt Bond Yield |
2.51% |
-0.02% |
|
|
Current Coupon Ginnie Mae TBA |
100.2 |
-0.5 |
|
|
Current Coupon Fannie Mae TBA |
100.7 |
0.4 |
|
|
RPX Composite Real Estate Index |
205.3 |
0.3 |
|
|
BankRate 30 Year Fixed Rate Mortgage |
4.51 |
Green on the screen after the 10 year bond recouped all of its early losses and ended up positive on the day. The Chinese central bank agreed to keep money-market rates at a “reasonable” level. Durable Goods orders came in at 3.6%, above the 3% estimate. Ex transportation, they were up .7%, above the consensus estimate. April numbers were revised up. Bonds and MBS are up.
Homebuilder Lennar reported 2Q earnings per share of $.61, ahead of the $.33 estimate. The numbers included a tax benefit, but even without the one-time item, earnings still beat estimates by ten cents. Deliveries were up 39%, new orders were up 27% and backlog was up 55%. Stuart Miller, the CEO addressed the recent increase in rates directly: “Against the backdrop of recent investor concerns over recent mortgage rate increases, we believe our second quarter results together with real-time feedback from our field associates continue to point towards a solid housing recovery….Demand in all of our markets continues to outpace supply…affordability remains high and despite recent interest rate increases, we have seen very little impact on sales or pricing.” The stock is up 4.5% pre-open.
Senators Corker and Warner plan to introduce their bill today to euthanize Fan and Fred. They will be replaced by the Federal Mortgage Insurance Corporation which will act as a re-insurer and not a primary insurer. How this will actually play out is anyone’s guess – right now there are no mortgage insurance entities big enough to replace F&F. Perhaps the answer will be to over-collateralize MBS backed by QM mortgages by 10% and then apply the FMIC insurance. Obviously Dodd-Frank will have to weigh in on that one, and they are still figuring that part out.
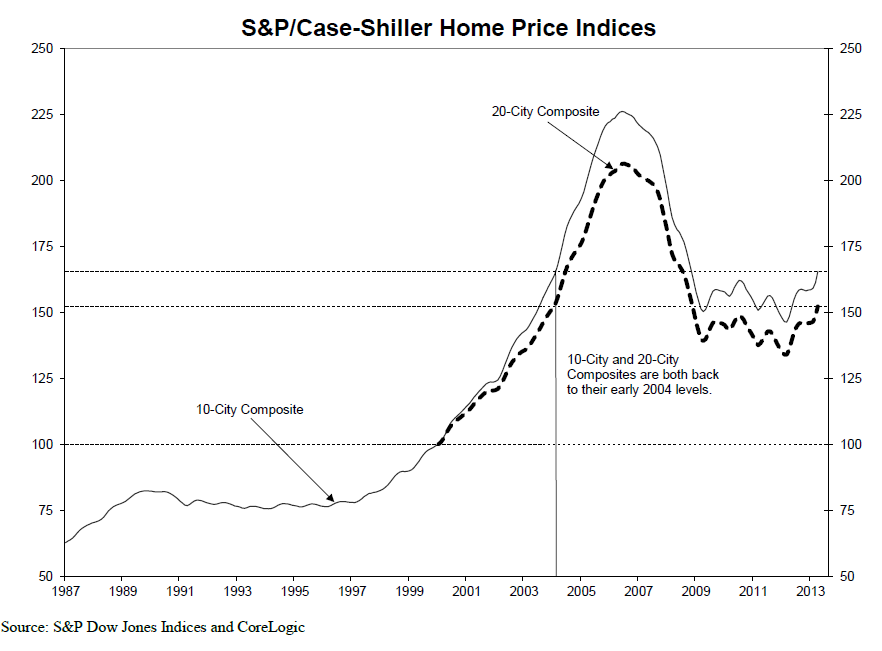
Lender Processing Services reported that April home prices were up 1.5% from March and 8.1% year-over-year. We are starting to see the Midwestern states start to show up in the top 10. California and Nevada are still #1 and #2 as usual. The LPS HPI is a little different than the other indices like Case-Shiller in that it applies a normalization process to REO and short sales in order to come up with a non-distressed index.
Case-Shiller reported home prices increased 1.72% month-over-month and 12.05% year-over year. This was the highest gain in the history of the Case-Shiller indices. David Blitzer of Case-Shiller addressed the recent increase in rates: “Last week’s comments from the Fed and the resulting sharp increase in Treasury yields sparked fears that rising mortgage rates will damage the housing rebound. Home buyers have survived rising mortgage rates in the past, often by shifting from fixed rate to adjustable rate loans. In the housing boom, bust, and recovery, banks’ credit quality standards were more important than the level of mortgage rates. The most recent Fed Senior Loan Officer Opinion Survey shows that some banks are easing credit restrictions. Given this, the recovery should continue.”
The FHFA Home price Index reported an increase of .7% month-over-month and 7.4% year-over year. Remember, each of these indices (LPS, Case-Shiller, and FHFA) have different methodologies and samples. FHFA looks only at properties with a conforming mortgage, which eliminates jumbos, distressed, cash-only, etc. This index is more of a “central tendency” index than Case-Shiller or LPS.
Filed under: Morning Report | 105 Comments »
Vital Statistics:
| Last | Change | Percent | |
| S&P Futures | 1568.5 | -15.6 | -0.98% |
| Eurostoxx Index | 2502.6 | -46.9 | -1.84% |
| Oil (WTI) | 93.38 | -0.3 | -0.33% |
| LIBOR | 0.277 | 0.004 | 1.47% |
| US Dollar Index (DXY) | 82.8 | 0.483 | 0.59% |
| 10 Year Govt Bond Yield | 2.64% | 0.11% | |
| Current Coupon Ginnie Mae TBA | 99.5 | -1.6 | |
| Current Coupon Fannie Mae TBA | 99.38 | -1.1 | |
| RPX Composite Real Estate Index | 205 | 0.2 | |
| BankRate 30 Year Fixed Rate Mortgage | 4.36 |

Filed under: Morning Report | 22 Comments »
Vital Statistics:
| Last | Change | Percent | |
| S&P Futures | 1590.7 | 6.8 | 0.43% |
| Eurostoxx Index | 2595.4 | 9.0 | 0.35% |
| Oil (WTI) | 95.37 | 0.2 | 0.24% |
| LIBOR | 0.273 | 0.000 | 0.07% |
| US Dollar Index (DXY) | 82.08 | 0.168 | 0.21% |
| 10 Year Govt Bond Yield | 2.39% | -0.03% | |
| Current Coupon Ginnie Mae TBA | 102.3 | -0.7 | |
| Current Coupon Fannie Mae TBA | 101.8 | 0.3 | |
| RPX Composite Real Estate Index | 204.8 | 0.3 | |
| BankRate 30 Year Fixed Rate Mortgage | 4.24 |

Finally, I recently did an interview on Capital Markets Today, where I talked about the Fed, shadow inventory, mortgage rates, and the real estate market. It is a deeper dive into what the Fed had to say (it was done right after the FOMC release). Check it out.
Filed under: Morning Report | Leave a comment »
Vital Statistics:
|
Last |
Change |
Percent |
|
|
S&P Futures |
1649.5 |
-2.1 |
-0.21% |
|
Eurostoxx Index |
2654.8 |
-11.8 |
-0.44% |
|
Oil (WTI) |
97.95 |
+0.2 |
+0.23% |
|
LIBOR |
0.273 |
0.000 |
0.00% |
|
US Dollar Index (DXY) |
80.92 |
-0.031 |
-0.04% |
|
10 Year Govt Bond Yield |
2.198% |
+0.02% |
|
|
Current Coupon Ginnie Mae TBA |
104.5 |
-0.1 |
|
|
Current Coupon Fannie Mae TBA |
103.1 |
-0.1 |
|
|
RPX Composite Real Estate Index |
203.4 |
0.5 |
|
|
BankRate 30 Year Fixed Rate Mortgage |
4.01 |
Another interesting tidbit – although it seems like the refi boom is over, it turns out that half of the outstanding mortgages in the U.S. have interest rates of 5% or more.
Filed under: Morning Report | 5 Comments »
Vital Statistics:
|
Last |
Change |
Percent |
|
|
S&P Futures |
1641.8 |
8.1 |
0.51% |
|
Eurostoxx Index |
2654.8 |
-11.8 |
-0.44% |
|
Oil (WTI) |
97.95 |
+0.2 |
+0.23% |
|
LIBOR |
0.273 |
0.000 |
0.00% |
|
US Dollar Index (DXY) |
80.92 |
-0.031 |
-0.04% |
|
10 Year Govt Bond Yield |
2.198% |
+0.02% |
|
|
Current Coupon Ginnie Mae TBA |
104.5 |
-0.3 |
|
|
Current Coupon Fannie Mae TBA |
103.1 |
-0.2 |
|
|
RPX Composite Real Estate Index |
203.4 |
0.5 |
|
|
BankRate 30 Year Fixed Rate Mortgage |
3.98.05 |
Filed under: Morning Report | 155 Comments »
