Posted on June 14, 2013 by Brent Nyitray
Vital Statistics:
| |
Last |
Change |
Percent |
| S&P Futures |
1632.7 |
1.8 |
0.11% |
| Eurostoxx Index |
2654.8 |
-11.8 |
-0.44% |
| Oil (WTI) |
95.66 |
-0.2 |
-0.23% |
| LIBOR |
0.273 |
0.000 |
0.00% |
| US Dollar Index (DXY) |
80.92 |
-0.031 |
-0.04% |
| 10 Year Govt Bond Yield |
2.21% |
-0.02% |
|
| Current Coupon Ginnie Mae TBA |
101.5 |
0.3 |
|
| Current Coupon Fannie Mae TBA |
99.8 |
0.7 |
|
| RPX Composite Real Estate Index |
203.4 |
0.5 |
|
| BankRate 30 Year Fixed Rate Mortgage |
4.05 |
|
|
Markets are higher this morning after a slew of economic data that was generally negative. Bonds and MBS are up.
In economic data this morning, the producer price index showed inflation remains in check at the wholesale level. Industrial Production and Capacity Utilization were lower than expected. Finally, the University of Michigan Consumer Confidence number fell. Yesterday, the Bloomberg Consumer Comfort Index fell, and the driver was people’s perception of their own financial situation. Perhaps the increase in interest rates is beginning to be felt.
Next week will be the FOMC meeting. Market participants will undoubtedly be focusing on the debate over tapering QE. Are they comfortable with the recent spike in long-term rates?
Mortgage investors are starting to rotate to
non-agency paper as rates rise. It is basically a bet that the housing market continues to improve. At the margin, it should put pressure on agency paper, which will increase borrowing rates.
We have already seen some of the effects of mortgage REIT deleveraging in the MBS space. The spread between Ginnie I and Ginnie II securities has narrowed, as well as the spread between Fannie Mae and Freddie Mac TBAs. Fannie Mae and Ginnie I TBAs generally trade at a premium to Freddie Mac TBAs and Ginnie II TBAs respectively. Why is this happening? Mortgage REIT deleveraging. The Ginnie Is and Fannie Mae TBAs are more liquid than the IIs and Freddie Macs. And when you are deleveraging, you sell what you can, not necessarily what you want to. Punch line? Ginnie loans and Fannie loans are getting more expensive relative to Freddie loans.
The MR will be spotty next week as I will be on the Left Coast.
Filed under: Morning Report | 11 Comments »
Posted on June 13, 2013 by Brent Nyitray
Vital Statistics:
| |
Last |
Change |
Percent |
| S&P Futures |
1612.3 |
2.4 |
0.15% |
| Eurostoxx Index |
2654.8 |
-11.8 |
-0.44% |
| Oil (WTI) |
95.66 |
-0.2 |
-0.23% |
| LIBOR |
0.273 |
0.000 |
0.00% |
| US Dollar Index (DXY) |
80.92 |
-0.031 |
-0.04% |
| 10 Year Govt Bond Yield |
2.21% |
-0.02% |
|
| Current Coupon Ginnie Mae TBA |
101.5 |
-0.2 |
|
| Current Coupon Fannie Mae TBA |
99.8 |
0.0 |
|
| RPX Composite Real Estate Index |
203.4 |
0.5 |
|
| BankRate 30 Year Fixed Rate Mortgage |
4.05 |
|
|
Markets are up on the back of a good retail sales number, in spite of an absolute shellacking (down 6.4%) in the Nikkei 225 index overnight. Initial Jobless Claims came in at 334k, a little better than expectations. The Import Price Index fell, which is bond bullish. Bonds and MBS are up small.
Advance Retail Sales were up .6% in the month of May, which was better than expected. Less autos and gasoline, they were up .3%, in line with expectations. April was revised downward from .5% to .2%. Building materials are increasing at a 10% clip, which bodes well for new construction.
It is probably too early for the back up in rates that started in May to start showing up in economic data, but is presence (or absence) will almost influence the Fed’s decision making on ending QE. Don’t forget The Bernank is done at the end of the year. The odds-on favorite is Janet Yellen to replace him and she is to the dovish side of Bernake. While I think it is a long shot, beware of a snap-back rally in bonds. That is when the
margin clerk finishes his business.
CoreLogic
reported that home equity increased 9% in the first quarter to reach $4.2 trillion. Negative equity fell 8% to $580 billion and the number of negative equity properties fell to 9.7 million from 10.5 million. CoreLogic estimates that if home prices increase another 5%, 1.6 million homes would regain positive equity. This should really help drive purchase business as homeowners who have been stuck finally are able to move. Combined with a recovering job market to lure in the first time homebuyer and still generally good affordability, maybe the purchase business will make up for some of the lost refi business. Caveat: If the increase in home price appreciation continues to be driven by all-cash bidding wars in Las Vegas, then the effect will be more muted. We need to see home price appreciation in places like the Northeast and Midwest for this to really start turning things around.
JP Morgan Chase is
cutting 1,800 jobs in its mortgage unit, with the hits primarily coming from servicing (as delinquencies fall) and its Albion NY call center (as the refi market dries up).
Filed under: Morning Report | 59 Comments »
Posted on June 12, 2013 by Brent Nyitray
Vital Statistics:
| |
Last |
Change |
Percent |
| S&P Futures |
1637.7 |
10.6 |
0.65% |
| Eurostoxx Index |
2697.5 |
14.3 |
0.53% |
| Oil (WTI) |
96.07 |
0.7 |
0.72% |
| LIBOR |
0.273 |
0.001 |
0.37% |
| US Dollar Index (DXY) |
81.15 |
0.037 |
0.05% |
| 10 Year Govt Bond Yield |
2.23% |
0.04% |
|
| Current Coupon Ginnie Mae TBA |
101.6 |
-0.3 |
|
| Current Coupon Fannie Mae TBA |
99.92 |
-0.2 |
|
| RPX Composite Real Estate Index |
202.8 |
-0.2 |
|
| BankRate 30 Year Fixed Rate Mortgage |
4.04 |
|
|
Markets are higher this morning after yesterday’s decline. This week is relatively data-light until Friday. Bonds ad MBS are down small.
Mortgage Applications rose 5% last week as the Bankrate 30 year fixed rate average fell from 4.1% to 4.03%. Refis were up 5%.
The sell-off in bonds and MBS has not only hit mortgage REITs like Annaly and American Capital, who are down 25% + in the last month, it has also hit some hedge funds as well.
$1.5 billion Metacapital is down 6.5% this year. The REITs are levered something like 6:1 and the hedge funds are undoubtedly levered as well. Margin calls could start soon, and when they happen, look out below. MBS are one of those investments that pretty much everyone is long, and there are few buyers when they get hit. The point of this: watch your locks. It is a dangerous environment to float in.
Corelogic has put out its latest
equity report. Just under 20% of all homes are underwater and negative equity fell by 8.7% in the first quarter.
Filed under: Morning Report | 16 Comments »
Posted on June 11, 2013 by Brent Nyitray
Vital Statistics:
| |
Last
|
Change
|
Percent
|
|
S&P Futures
|
1625.6
|
-16.5
|
-1.00%
|
|
Eurostoxx Index
|
2661.6
|
-57.8
|
-2.13%
|
|
Oil (WTI)
|
94.47
|
-1.3
|
-1.36%
|
|
LIBOR
|
0.272
|
-0.002
|
-0.69%
|
|
US Dollar Index (DXY)
|
81.46
|
-0.186
|
-0.23%
|
|
10 Year Govt Bond Yield
|
2.26%
|
0.05%
|
|
|
Current Coupon Ginnie Mae TBA
|
101.2
|
-0.2
|
|
|
Current Coupon Fannie Mae TBA
|
99.55
|
-0.5
|
|
|
RPX Composite Real Estate Index
|
203
|
0.6
|
|
|
BankRate 30 Year Fixed Rate Mortgage
|
4.06
|
|
|
Thought I had posted this earlier, but it looks like it didn’t take
Markets are lower after the Bank of Japan left policy unchanged. Bonds and MBS are heavy again, with the 10 year yielding 2.26%
Part of the issue with the weakness in the bond and MBS market is convexity-related hedging. Convexity hedging is coming out of the mortgage REITs primarily, but also anyone who holds mortgages as an investment and hedges the interest rate risk. The “inside baseball” explanation of what is going on: Mortgage REITs are finding that as rates increase, the duration of their mortgage backed securities increases. This means they have to either sell MBS or Treasuries to rebalance their hedge.” The punch line: selling begets more selling. And that is partly why the 10 year and MBS cannot get out of their own way.
The NFIB Small Business Optimism report ticked up to 94.4 in June, the highest level in a year, and the second highest reading since the recession started in 2007. That is the good news. The bad news? The number is still very weak, and only slightly higher than the post-recession average. The biggest headaches for small business? Taxes, Government regulations / red tape, and poor sales. In that order. The elephant in the room is obamacare. The report highlights one of the big disconnects happening right now, with the S&P 500 near record levels. The big multinationals are doing fine, but small business is barely growing with population. Since small business is half of the economy, it explains why we can have record levels in the S&P 500 and “meh” economic growth.If multinational profits correspond to 4% GDP growth, and the small business sector profits correspond to 0% GDP growth, you get 2% growth as an average number.
Traders are well aware of the “fat finger” phenomenon. This happens when you are entering an order and accidentally hit two keys at once, turning an order to buy 100,000 shares into an order to buy 1,200,000 shares. Well, we have a fat head error. And no, I am not talking about the one where a guy ordered a Tom Brady Fathead poster for his office and got Tebow instead.
Remember eminent domain? It’s baaaack. Or at least advocates have some new ammunition – a paper by Cornell law professor Robert Hockett. He argues that municipalities should, in partnership with investors, “condemn” underwater mortgage notes, pay mortgagees “fair value” and systematically write down principal. Of course any municipality that pursues this will effectively be cutting their citizens off from Fannie Mae / Freddie Mac / Ginnie Mae loans.
Filed under: Morning Report | 1 Comment »
Posted on June 10, 2013 by Brent Nyitray
Vital Statistics:
| |
Last |
Change |
Percent |
| S&P Futures |
1644.8 |
6.2 |
0.38% |
| Eurostoxx Index |
2716.5 |
-7.6 |
-0.28% |
| Oil (WTI) |
95.33 |
-0.7 |
-0.73% |
| LIBOR |
0.274 |
-0.001 |
-0.36% |
| US Dollar Index (DXY) |
81.82 |
0.146 |
0.18% |
| 10 Year Govt Bond Yield |
2.18% |
0.01% |
|
| Current Coupon Ginnie Mae TBA |
101.5 |
0.1 |
|
| Current Coupon Fannie Mae TBA |
100.1 |
-0.2 |
|
| RPX Composite Real Estate Index |
202.4 |
0.2 |
|
| BankRate 30 Year Fixed Rate Mortgage |
4.03 |
|
|
Markets are higher this morning on no real news. There is no economic data this morning. Bonds are weaker, with the 10 year yield at a 16 month high of 2.18%. MBS are down small.
Pretty light week, data wise. We will get NFIB Small business Optimism on Tuesday, retail sales on Thursday, and industrial production / capacity utilization on Friday. None of these should be market moving.
Compass Research is out saying the death of NJ Senator Frank Lautenberg pretty much makes Mel Watt an unlikely confirmation. It drops his “yes” votes from 56 to 55. Separately, KBW is out saying that Fannie Mae common stock is worthless. Of course is still sports a $11.4 billion market cap
Home equity increased by $816 billion in Q1, according to the
housing scorecard, put out by HUD. Delinquencies are down 7% in the month of May. In spite of the back up in mortgage rates, housing still remains highly affordable.
US bond fund redemptions are the
highest since 1992. Bill Gross, who’s fund lost 1.9% in May predicted that April of 2013 will go down as the end of the three decade bull market in bonds that began in the early 1980s. A poll by Bloomberg predicts that the Fed will cut its quantitative easing program from $85 billion a month to $65 billion a month at the October 29-30 FOMC meeting.
Filed under: Morning Report | 38 Comments »
Posted on June 7, 2013 by Brent Nyitray
Vital Statistics:
| |
Last |
Change |
Percent |
| S&P Futures |
1631.1 |
8.4 |
0.52% |
| Eurostoxx Index |
2695.6 |
19.4 |
0.72% |
| Oil (WTI) |
94.28 |
-0.5 |
-0.51% |
| LIBOR |
0.275 |
0.001 |
0.33% |
| US Dollar Index (DXY) |
81.47 |
-0.067 |
-0.08% |
| 10 Year Govt Bond Yield |
2.11% |
0.03% |
|
| Current Coupon Ginnie Mae TBA |
102.2 |
0.1 |
|
| Current Coupon Fannie Mae TBA |
100.6 |
-0.1 |
|
| RPX Composite Real Estate Index |
202.2 |
0.3 |
|
| BankRate 30 Year Fixed Rate Mortgage |
3.98 |
|
|
Markets are higher after the jobs report came in pretty much in line. Bonds and MBS are flat / down small.
The
jobs report showed that nonfarm payrolls increased by 175,000 in the month of May, slightly higher than Street estimates (which were lowered after the ADP report). April was revised downward from 165k to 149k. The unemployment rate ticked up from 7.5% to 7.6% as the labor force participation rate ticked up from 63.3% to 63.4%. Earnings and workweek were flat. Since the report was pretty much in line with expectations,we aren’t seeing any big reaction in the markets.
Remember my question about mortgage rates on
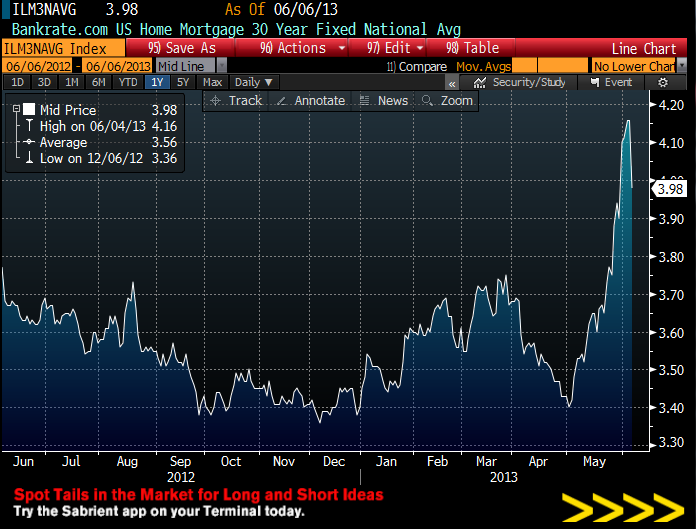
Wednesday? Basically how did the Bankrate average 30 year mortgage rate jump from 3.9% to 4.1% when the bond market was flat and we had a weak day in Fannie TBAs? Well, whatever it was, it has been reversed, as the Bankrate average 30 year mortgage rate fell 18 bps back to 3.98%. Strange.

Filed under: Morning Report | 51 Comments »
Posted on June 6, 2013 by Brent Nyitray
Vital Statistics:
| |
Last |
Change |
Percent |
| S&P Futures |
1611.6 |
3.6 |
0.22% |
| Eurostoxx Index |
2725.5 |
16.2 |
0.60% |
| Oil (WTI) |
94.24 |
0.5 |
0.53% |
| LIBOR |
0.274 |
0.000 |
-0.07% |
| US Dollar Index (DXY) |
82.35 |
-0.248 |
-0.30% |
| 10 Year Govt Bond Yield |
2.11% |
0.03% |
|
| Current Coupon Ginnie Mae TBA |
101.8 |
-0.2 |
|
| Current Coupon Fannie Mae TBA |
100.2 |
-0.2 |
|
| RPX Composite Real Estate Index |
201.9 |
0.1 |
|
| BankRate 30 Year Fixed Rate Mortgage |
4.16 |
|
|
Markets are flattish after initial jobless claims came in as expected. Challenger and Gray reported that announced layoffs are 41% below last year’s pace. Bonds and MBS are flat.
Moderate. Modest. Measured. That is the summary of the
Fed’s Beige Book Survey of economic growth. The bright spot of the report was residential real estate construction. The Dallas District noted the strongest growth, while growth elsewhere was modest to moderate. Since this report is basically as amalgam of the various Federal Reserve District reports which have been previously released, it isn’t a market-mover.
The Senate plan to wind down the GSE’s (Corker / Warner) would liquidate Fannie and Fred, transfer all of their liabilities to Treasury. The liquidation preference would be to the US Government first, then the junior prefs, and then the common shares. Note that Fannie Mae and Freddie Mac’s recent record profits have not gone to paying down their debt to the government – those funds have been simply revenues to the government. A new entity – The Federal Mortgage Insurance Commission would have a re-insurance role and backstop private insurance. Ginnie Mae would not be affected.
Filed under: Morning Report | 56 Comments »
Posted on June 5, 2013 by Brent Nyitray
Vital Statistics:
| |
Last |
Change |
Percent |
| S&P Futures |
1625.1 |
-6.1 |
-0.37% |
| Eurostoxx Index |
2723.4 |
-32.3 |
-1.17% |
| Oil (WTI) |
93.76 |
0.5 |
0.48% |
| LIBOR |
0.274 |
0.001 |
0.18% |
| US Dollar Index (DXY) |
82.58 |
-0.192 |
-0.23% |
| 10 Year Govt Bond Yield |
2.12% |
-0.02% |
|
| Current Coupon Ginnie Mae TBA |
101.8 |
0.0 |
|
| Current Coupon Fannie Mae TBA |
100.3 |
-0.8 |
|
| RPX Composite Real Estate Index |
201.8 |
0.4 |
|
| BankRate 30 Year Fixed Rate Mortgage |
4.16 |
|
|
Markets are weaker after a disappointing ADP report. Nonfarm productivity was revised downward to .5% while unit labor costs fell. The Fed will release its Beige Book later on this afternoon. Mortgage applications fell 11.5% last week. Bonds and MBS are up small on the data.
The ADP report is supposed to foreshadow Friday’s all-important jobs report, albeit only the private sector portion. Basically take the jobs report, subtract out public sector workers, and you have ADP. The ADP employment change report came in at 135,000 vs expectations of 165,000. Friday’s payroll report is expected to be 178,000, with an unchanged unemployment rate of 7.5%. Bonds spiked on the ADP number and have pretty much given it all back. I am struggling to come up with a scenario where bonds rally big on Friday. My guess is that it will take an increase in the unemployment rate (like 7.7%) and a lousy payroll number, like 50k. The bond market increases so grudgingly, it feels like it won’t take much of an upside surprise to send it lower.
I first thought it was a data error, or a misprint. On Friday, the Bankrate US Home Mortgage 30 year Fixed National Average spiked from 3.9% to 4.1%. But it increased again on Monday and Tuesday and now is sitting at 4.16%. Over that period, the 10 year is unchanged, but the FNCL 3.5 TBA is down a point, which corresponds to a 22 bp increase in yield. The GNSF 3.5 is down 14 ticks, which corresponds to a 10 basis point increase in yield. So how do we get a 26 basis point increase in mortgage rates when Fannies are up 22bps and Ginnies are up 10? And no, its not jumbos, which only increased 4 basis points. Strange things are afoot at the Circle K.

Filed under: Morning Report | 18 Comments »
Posted on June 4, 2013 by Brent Nyitray
Vital Statistics:
| |
Last
|
Change
|
Percent
|
|
S&P Futures
|
1638.5
|
2.3
|
0.14%
|
|
Eurostoxx Index
|
2765.3
|
17.5
|
0.64%
|
|
Oil (WTI)
|
93.19
|
-0.3
|
-0.28%
|
|
LIBOR
|
0.274
|
0.001
|
0.26%
|
|
US Dollar Index (DXY)
|
82.81
|
0.149
|
0.18%
|
|
10 Year Govt Bond Yield
|
2.13%
|
0.01%
|
|
|
Current Coupon Ginnie Mae TBA
|
101.9
|
-0.2
|
|
|
Current Coupon Fannie Mae TBA
|
100.4
|
-0.1
|
|
|
RPX Composite Real Estate Index
|
201.5
|
0.6
|
|
|
BankRate 30 Year Fixed Rate Mortgage
|
4.11
|
|
|
Markets are up small after a 2% rally in Japan’s Nikkei 225 index last night. Bonds and MBS are down small.
Yesterday’s ISM report showed the manufacturing sector contracted slightly in May. New Orders and Production fell, while inventories rose. Employment was flat. The index level of 49 corresponds to a GDP growth rate of just about 2%.
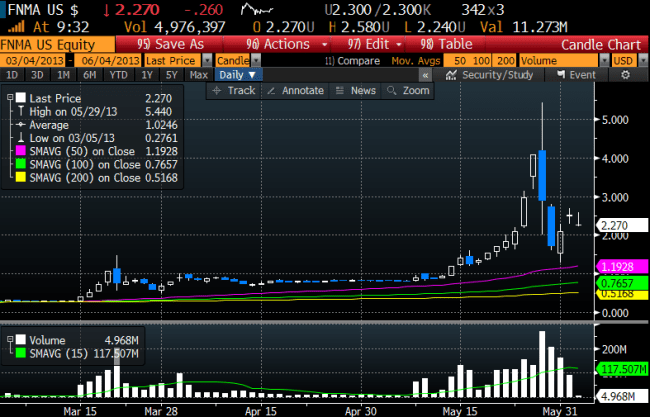
The Senate is close to establishing a plan to abolish Fannie Mae and Freddie Mac and replace them with a government re-insurer that would backstop private mortgage insurance. F&F would be wound down and the US Treasury would assume responsibility for existing conforming loans. A new entity – the Federal Mortgage Insurance Corporation (FMIC) would provide re-insurance, which means they would only step in if the private mortgage insurer was unable to cover the losses. For holders of the junior preferreds, which includes a lot of big hedge funds, this doesn’t look like anything good for them.
And for those keeping track at home, here is Fannie Mae’s recent chart:
Filed under: Morning Report | 49 Comments »
Posted on June 3, 2013 by Brent Nyitray
Vital Statistics:
| |
Last |
Change |
Percent |
| S&P Futures |
1634.2 |
5.2 |
0.32% |
| Eurostoxx Index |
2772.8 |
3.1 |
0.11% |
| Oil (WTI) |
92.68 |
0.7 |
0.77% |
| LIBOR |
0.273 |
-0.002 |
-0.73% |
| US Dollar Index (DXY) |
83.15 |
-0.228 |
-0.27% |
| 10 Year Govt Bond Yield |
2.16% |
0.03% |
|
| Current Coupon Ginnie Mae TBA |
101.8 |
-0.1 |
|
| Current Coupon Fannie Mae TBA |
100.4 |
-0.3 |
|
| RPX Composite Real Estate Index |
200.8 |
0.3 |
|
| BankRate 30 Year Fixed Rate Mortgage |
4.1 |
|
|
Markets are higher on no real news. We will get an important manufacturing report at 10:00 am est with the ISM Manufacturing Report. Bonds and MBS are down small.
Lots of data this week, with the ISM Manufacturing Survey later this morning, Unit labor costs and productivity on Wed and the jobs report on Friday. The jobs report will obviously be the biggest report of the week. The Street is expecting an increase of 177 jobs and a 7.5% unemployment rate. 177,000 jobs is on the low side of recent history.
Federal Reserve Bank of San Francisco President John Williams
confirmed the conventional wisdom in the bond market – that the Fed may start reducing asset purchases with an eye towards ending QE by year end. “With continued good signs on jobs and confidence in a substantial improvement, I could see as early as this summer, some adjustment, maybe modest adjustment downward in our bond purchase program.” The program is doing this great job of helping the economy gain momentum and I would want to see that continue well into the second half of the year, but if things, again iff they go well, you could imagine ending the program by the end of the year.”
The sell-off in bonds has been painful for PIMCO: Bill Gross’s Total Return Fund
lost 2.2% last month.
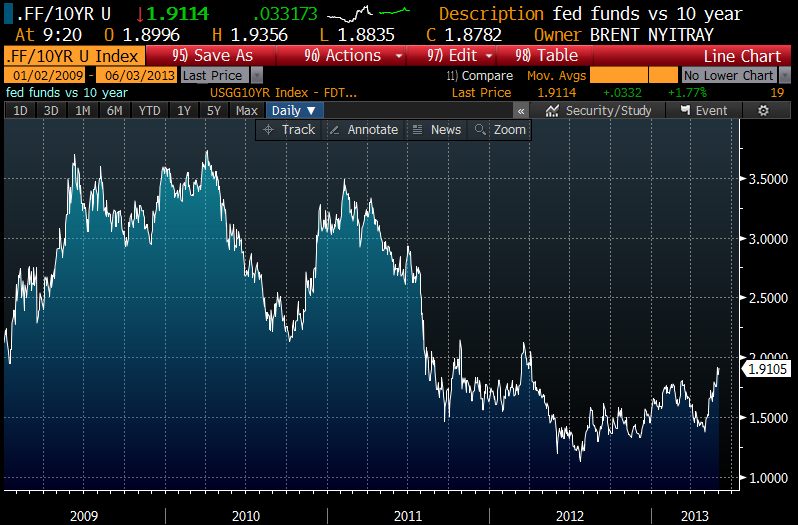
If the Fed ends QE, how high can we expect 10 year yields to go? Actually, a lot higher. The following chart shows the difference between the 10 year bond and the Fed Funds rate since it was set at 25 basis points in early 2009. Since we know the Fed is probably going to wait until unemployment gets closer to 6% before making any moves with the Fed Funds rate, we can assume that stays constant for the near term. But this chart shows we have gotten used to a flat yield curve over the past year. And that may be about to change.
Chart: 10 year bond yield minus the Fed Funds Rate

Filed under: Morning Report | 69 Comments »