

Vital Statistics:
| Last | Change | Percent | |
| S&P Futures | 1904.4 | 7.5 | 0.40% |
| Eurostoxx Index | 3241.0 | 0.6 | 0.02% |
| Oil (WTI) | 104.3 | 0.0 | -0.04% |
| LIBOR | 0.23 | 0.001 | 0.22% |
| US Dollar Index (DXY) | 80.33 | -0.065 | -0.08% |
| 10 Year Govt Bond Yield | 2.54% | 0.01% | |
| Current Coupon Ginnie Mae TBA | 106.4 | 0.0 | |
| Current Coupon Fannie Mae TBA | 105.5 | 0.0 | |
| BankRate 30 Year Fixed Rate Mortgage | 4.16 |

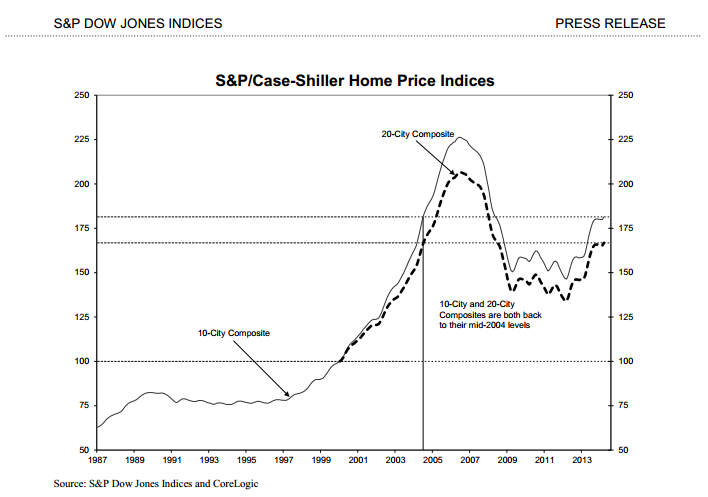
So, according to FHFA, we are within 6% of the peak and prices are at mid 2005 levels and according to Case-Shiller, we are within 20% of the peak and prices are at mid 2004 levels. Who is right? The answer is both. Case-Shiller is a broad-based index, while FHFA is narrower. The FHFA index only looks at homes with a conforming mortgage, which means it excludes jumbos and cash sales, which have been historically distressed properties, although that is changing.

Mohammed El-Arian weighs in on what is going on in the bond market. Speculators are net short Treasuries in a big way, and pension funds are redeploying stock market gains into the bond market. That makes for a tight market. You could almost feel the stops getting triggered a couple of weeks ago when we broke out of our 2.6% – 2.8% trading range:

Always-thoughtful Gary Shilling talks about how a financial crisis in China could be the catalyst for a massive “risk-off” trade, which would mean the rally in bonds could last longer than people think. Note that mortgage REITs (one of the biggest investors in mortgage backed securities) are leaning that way.
Filed under: Morning Report | 42 Comments »
