A Surprising Map

religious map

Morning Report – The Fed frets about excessive risk-taking 6/4/14

Vital Statistics:


  Last Change Percent
S&P Futures  1917.9 -3.9 -0.20%
Eurostoxx Index 3240.1 -7.7 -0.24%
Oil (WTI) 102.5 0.1 0.06%
LIBOR 0.227 0.000 0.11%
US Dollar Index (DXY) 80.49 -0.150 -0.19%
10 Year Govt Bond Yield 2.55% 0.02%  
Current Coupon Ginnie Mae TBA 106.5 0.1  
Current Coupon Fannie Mae TBA 105.5 0.1  
BankRate 30 Year Fixed Rate Mortgage 4.18    


Stocks are down (and bonds are up) after the weak ADP jobs report, which is signalling a weak nonfarm payrolls number on Friday. 
 
ADP payrolls came in at 179k, below the 210k expectation. The Street is forecasting 215k jobs for Friday’s report. FWIW, the ADP report has been downright lousy at predicting the big number lately (notwithstanding last month), so I wouldn’t read too much into it. 
 
Mortgage applications fell 3.1% last week, even though mortgage rates fell a couple bps. Purchasese fell 3.6%, while refis fell 2.9%. 
 
The final revision for first quarter productivity came in at -3.2%. Unit labor costs rose 5.76%. Not sure how much of that was driven by obamacare / bad weather. Flattening productivity growth could be a good thing generally, as it means employers have squeezed just about all they can get from current employees and will need to hire more (or spend more on CAPEX). Either one is bullish for the economy.
 
The ISM Services index jumped to 56.3 in May, versus 55.2 in April and expectations of 55.5. Not quite post recession highs, but close. So we continue with the pattern of strong data, weak data. 
 
The Markit US Services PMI and composite PMI were both strong, although a little weaker than April. Still a 58 handle is a good number regardless.
 
The census bureau has a cool application where you can find out all about trends in home construction – things like typical number of bedrooms, number of bathrooms, square footage, amenities. One thing that jumps out is that the luxury end is doing better – we are building less homes under 1800 square feet, and the big percentage growth is in the 4000 + square feet bucket. The smaller starter homes probably won’t get built until the first time homebuyer feels confident enough about the future to buy. Household formation remains depressed, which is keeping housing starts depressed, which is keeping the economy stuck on a 2% growth trajectory instead of a 3% growth trajectory. The turnaround will happen – I thought it would be this year, but it is looking like a 2015 event. I’m starting to feel like Linus in the pumpkin patch preaching about pent-up demand, while waiting for a 1.5 million housing starts print.


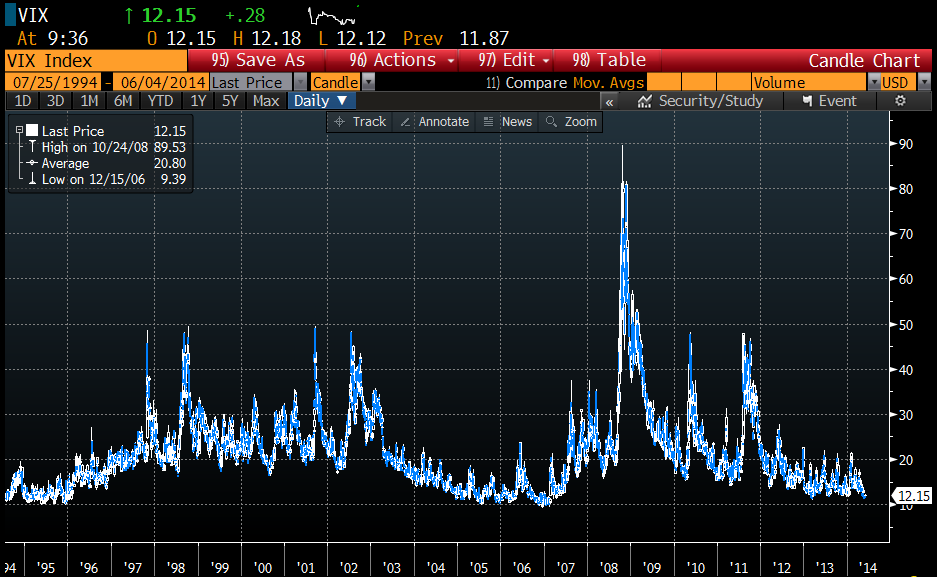
The calm before the storm? The Fed is worried about complacency in the markets. The VIX index has gone 74 straight weeks below its long-run average, which is a similar environment to 2006 – 2007. Junk spreads are widening, and junk issuance is growing as investors reach for yield. William Dudley commented: “Volatility in the markets is unusually low… I am a little bit nervous that people are taking too much comfort in this low-volatility period. As a consequence, they’ll take more risk that really what’s appropriate.” For what its worth, I think the VIX is useful for describing what has already happened in the market, not as a predictor of what is going to happen. Yes, there is the old market saw of “VIX is high, time to buy, VIX is low, time to go,” but a low VIX doesn’t necessarily mean markets are going to fall out of bed – look at the low VIX levels in 94-95, which preceded the mother of all stock market rallies. VIX invariably spikes AFTER the fit hits the shan, not before. It represents market players paying up for option protection, and that is a trailing indicator, not a leading one.


With respect to the junk issuance, investors (in particular defined benefit pension funds and insurance companies) are reaching for yield because the rate of inflation for their liabilities is largely insensitive to interest rates. The actuarial tables couldn’t care less if the Fed is driving down rates via QE – they need to earn X% on their fund to cover expected costs and that’s that. If they can’t get that in Treasuries, they’ll move to assets that can. Invariably that means they have to move out on the risk curve. We have seen this movie before, in the 1950s. FWIW, Dr. Cowbell thinks low rates are here to stay, and that “this time is different.” Most dangerous words in investing, ever. Anyway, it is nice to see the Fed muse about excessive risk taking, although IMO the biggest risk is probably in the so-called “risk free” long bond. 


Morning Report – 40% of modded mortgages are still underwater 6/3/14

Vital Statistics:

Last Change Percent
S&P Futures 1917.9 -3.9 -0.20%
Eurostoxx Index 3240.1 -7.7 -0.24%
Oil (WTI) 102.5 0.1 0.06%
LIBOR 0.227 0.000 0.11%
US Dollar Index (DXY) 80.49 -0.150 -0.19%
10 Year Govt Bond Yield 2.55% 0.02%
Current Coupon Ginnie Mae TBA 106.5 -0.1
Current Coupon Fannie Mae TBA 105.5 -0.2
BankRate 30 Year Fixed Rate Mortgage 4.18


Markets are lower this morning on no real news. Bonds and MBS are down. The automakers will be releasing May auto sales throughout the day – so far GM and Ford have both reported strong numbers.
In other economic data, ISM New York increased from 50.6 to 55.3. April factory orders increased .7% (and March was revised upward from 1.1% to 1.5%). Finally, the IBD / TIPP Economic Optimism Index came in better than expected to 47.7 from 47.
Yesterday, bond traders were given a quite the headfake with two incorrect reports for the ISM Manufacturing Index (a rather important economic indicator). The initial report had the index missing expectations significantly – a reading of 53.2 versus expectations of 55.5. This was a bond bullish number. However, later that morning they corrected the number to 56. Stronger number, so bond bearish. Finally, they got it right and reported the true number 55.4 – more or less in line with expectations. The market was probably more sensitive to this number than it should have been, but April’s economic data has been all over the place, and Friday’s jobs report looms large.
Home Prices increased 10.5% nationwide in April, according to CoreLogic. They are forecasting home price appreciation to moderate over the next year, with a prices expected to increase 6.3%. Excluding distressed sales, prices increased 8.3%. Overall, prices remain 14.3% below their April 2006 peak. Note that the FHFA Home Price Index has us within about 6% of the peak, but FHFA is a subset of the market in that it only looks at homes with conforming mortgages on them. 95% of the MSAs reported price increases.
The latest Black Knight Mortgage Monitor is out, with data through April 2014. Roughly 40% of the homes who received mortgage modifications are still underwater. We are finally seeing the judicial foreclosure states work through their pipelines, which is why we are starting to see more home price appreciation there. New York and New Jersey are making progress, while Massachusetts is not (and in fact is suing Fannie and Freddie over resisting their foreclosure prevention program). Sadly, it never seems to occur to politicians that policies designed to prevent foreclosures prevent price appreciation. They have this view that home prices are simply too important to be determined by a mere market.


Morning Report – The bubble in bonds 6/2/14

Vital Statistics:

Last Change Percent
S&P Futures 1922.6 1.1 0.06%
Eurostoxx Index 3248.0 3.4 0.11%
Oil (WTI) 102.4 -0.3 -0.27%
LIBOR 0.227 0.000 -0.11%
US Dollar Index (DXY) 80.52 0.147 0.18%
10 Year Govt Bond Yield 2.50% 0.03%
Current Coupon Ginnie Mae TBA 106.6 -0.1
Current Coupon Fannie Mae TBA 105.8 -0.1
BankRate 30 Year Fixed Rate Mortgage 4.15


Markets are flattish on no real news. Bonds and MBS are down
More disappointing economic data – the ISM Manufacturing report dropped from 54.9 to 53.2 in May and construction spending rose .2%. Both numbers were below expectations.
We will get the jobs report on Friday, and given the almost contradictory economic data we have been getting, I have no idea what to expect. I could see a 100k print. I could see a 300k print. FWIW, the street is at 215k, with a tick up in the unemployment rate to 6.4%.
Cash deals account for 29% of all sales, according to Bloomberg. Retiring baby boomers are choosing to own homes outright, as opposed to having a mortgage. Historically that number has been closer to 20%, and I have seen cash estimates as high as 40%.
In a related note, QE has rendered many economic risk models (particularly the Fed model for stocks) useless. Old definitions of “cheap” and “expensive” no longer apply in a world of unprecedented central bank stimulus and stubbornly low inflation. When investors start re-defining what “cheap” and “expensive” mean (think internet stocks in 1999), that is a signal that we are in bubble territory.
I would like to tie the two articles together – what sort of bet is buying a house with cash? Well, it is a real estate bet- going long real estate. However, by choosing not to get a mortgage, it is also a bond bullish bet, in a way. Lending is the act of going long bonds. Borrowing is the act of going short bonds. IMO, the baby boom is effectively doubling down on the bond bullish bet. They are making a very questionable bet that central banks around the world can stick the landing and exit this unprecedented stimulus without (a) crashing the bond market and (b) creating inflation. IMO, the risks are all to the downside in the bond market, and instead of buying homes with cash, I would be borrowing as much as I could at 4% interest rates. The baby boom drove the stock market bubble in the late 90s, the residential real estate bubble in the 00s, and are drinking the bond market kool aid now. I don’t think this ends well.

Gay Conservatives Denied ‘Official’ Spot at Texas GOP Convention

From KUT in Austin I heard the following.

The Texas Republican Party has denied the Log Cabin Republicans a space at next week’s state convention. Log Cabin Republicans represent gay conservatives and supporters of marriage equality in the party.

Log Cabin Republican Executive Director Gregory Angelo says the state party denied the group’s application for a booth at the convention because, as homosexuals, they disagree with a plank in the party platform. The plank reads, in part, that “homosexuality tears at the fabric of society.”

“It was our obligation to let the voters of Texas know and to let members of the Republican Party in Texas know that that language is in the party platform and it is being used to intentionally exclude gay Republicans from formal participation in the state GOP convention,” Angelo says.

A state party is not purely a private club.  We learned that early in the civil rights struggles for black Texans.  In Smith v. Allwright (1944), the Supreme Court ruled on a challenge to a 1923 Texas state law that had delegated authority to state conventions of political parties to make rules for their primaries. It ruled that the law violated the protections of the Constitution because the state allowed a discriminatory rule (no “negroes”) to be established by the Democratic Party.  However, homosexuals are not being excluded here per se – in fact, the Log Cabin Rs who were elected delegates will be in attendance and will be voting.  They will not be allowed a “booth”.

My own view of this bolded language in the Texas Republican platform is that it is wrong as a matter of fact and deeply prejudiced as a matter of practice. It is prejudiced as a matter of practice because no individual homosexual could be judged upon her own gifts and graces if her self-identification as a homosexual tears at the fabric of society.

The plank will not scare off any Rs in TX.  Those who disagree with it will think it is a low priority and those who agree with it will strongly approve.  There is a difference of enthusiasm here.

QB noted those of us who don’t think consenting private sexual conduct is a moral issue do so by reason of a libertarian slant.  He made the case that while he did not believe there should be legal consequences for CPA sex, same sex marriage was not itself private conduct.  This plank morally condemns private conduct and, I think, even status.  While codifying this moral condemnation into law is not a requisite, I think it would be a natural result, because it happened historically.

Imagine yourself on the platform committee of the Texas Republican Party.  Do you vote for or against this plank?  Do you argue for or against it, and if you do, do you argue on moral or political grounds?  Do you think it is an important plank or a throwaway?


Morning Report – More mixed economic data 5/30/14

Vital Statistics:

Last Change Percent
S&P Futures 1911.2 2.1 0.11%
Eurostoxx Index 3240.5 -5.7 -0.18%
Oil (WTI) 102.9 0.2 0.19%
LIBOR 0.227 0.000 -0.11%
US Dollar Index (DXY) 80.45 -0.121 -0.15%
10 Year Govt Bond Yield 2.44% 0.00%
Current Coupon Ginnie Mae TBA 106.8 0.0
Current Coupon Fannie Mae TBA 106 0.1
BankRate 30 Year Fixed Rate Mortgage 4.13


Markets are down small after some disappointing consumption data this morning. Bonds are taking a breather and are down small.
Personal Incomes rose .3% in April, while spending fell .1%. Inflation remains in check. The income number was in line with Street expectations, while the spending number was not. March’s spending number was revised upward from .9% to 1.0%. University of Michigan Consumer Confidence ticked up slightly to 81.9, although it came in lower than expectations.
The ISM Milwaukee report leaped to 63.5 from 47.3 a month ago, while the Chicago Purchasing Manager’s Index increased from 63 to 65.5. These numbers beat expectations handily. April has had some very divergent economic indicators, with the weak industrial data points to some of these other strong indicators.
Refis dropped to 37% of all closed loans in April, according to Ellie Mae. Average FICOs ticked up a point to 726. Average days to close a loan fell to 39.
With rates falling over the past month or two, where are we going to get a wave of refis? The conventional wisdom is 4% mortgage rates. Remember, however the concept of prepayment burnout, which means that each successive dip in rates has less of an effect on refinance activity, mainly because the pool of people with a refinancable mortgage shrinks. That said, home price appreciation is counteracting that effect as people who were underwater last year and unable to refinance are able to take advantage of it this time around.
More speculation on what is going on in the bond market. Interestingly, according to Commitment of Traders data, speccies are increasing short exposure – the bears are fading the rally, not capitulating. Interestingly, the Fed’s balance sheet actually shrunk over the past week – not by a lot – but still it is surprising. At the end of the day, absent some sort of valid technical explanation of the strength, you have to believe the stock market is telling you one thing and the bond market is telling you another.

Morning Report – Terrible revision to Q1 GDP 5/29/14

Vital Statistics:

Last Change Percent
S&P Futures 1911.2 2.1 0.11%
Eurostoxx Index 3240.5 -5.7 -0.18%
Oil (WTI) 102.9 0.2 0.19%
LIBOR 0.227 0.000 -0.11%
US Dollar Index (DXY) 80.45 -0.121 -0.15%
10 Year Govt Bond Yield 2.44% 0.00%
Current Coupon Ginnie Mae TBA 106.8 -0.1
Current Coupon Fannie Mae TBA 106 0.0
BankRate 30 Year Fixed Rate Mortgage 4.13


Markets are higher after some mixed economic data. Bonds and MBS continue their rally.
First quarter GDP was revised downward to -1% (the Street was at -.5%). Obviously the Street is happy to accept the weather excuse and give the market a mulligan. Personal consumption rose 3.1%, and initial jobless claims fell to 300k.
Pending Home Sales increased .4% month-over-month, but fell 9.4% year, over year. They rose .5% in the Northeast, 4.7% in the Midwest, fell .7% in the South and fell 2.6% in the West.
What is going on with bond yields? The economic data has been “meh,” not weak, so why are we below 2.45%? Not sure, most explanations feel like justifications, not reasons. It could be nothing, but keep in the back of your mind that the bond market is telling you something, and you’ll find out the reason for the strength later on. For LOs, this is a good time to wake up borrowers that missed out on refinancing last fall, or buyers who were hoping for a better rate.

Freddie Mac has a new housing index (similar to the NAHB’s Improving Market Index) which shows strength in housing markets. They call it the Multi-Indicator Market Index, and it uses 4 indicators to create the index: purchase applications, payment to income rations, percent of borrowers current on their mortgage, and employment. Nationally, the index shows that the recovery has largely stalled. According to Freddie Mac Chief Economist Frank Nothaft: “Less than half of the housing markets MiMi covers are showing an improving trend, whereas at the same time last year more than 90 percent of these same markets were headed in the right direction.” Since we know that delinquencies have been dropping and the job market has been improving, the culprit is purchase applications. Between higher prices and higher mortgage rates, buyers, especially first time homebuyers, are getting sticker shock. That said, the index ignores cash purchases, and you have to take that into account, so the index is undoubtedly overstating the weakness. Here is an example of the index for Miami and the National MiMi:

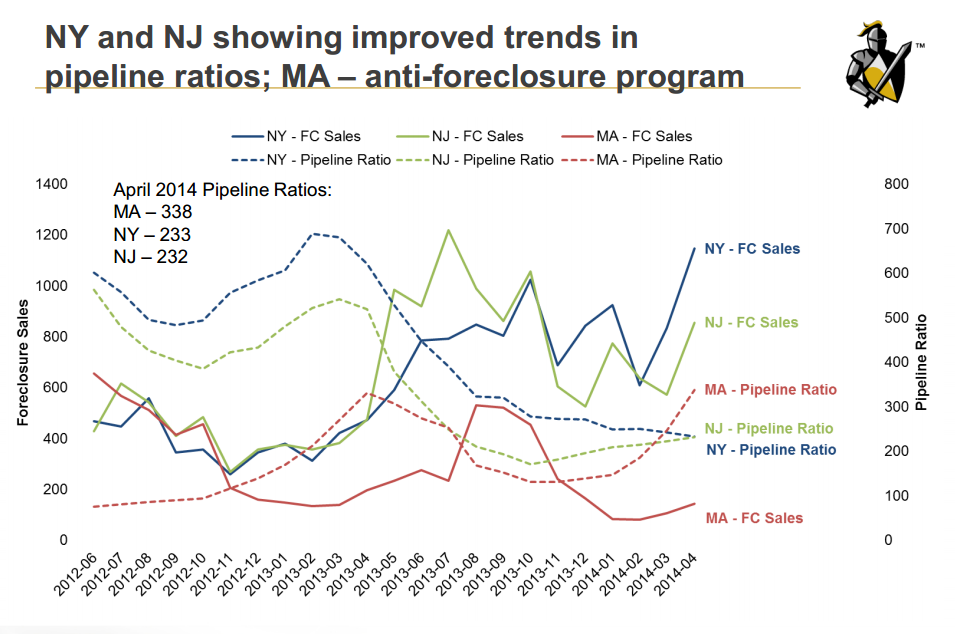
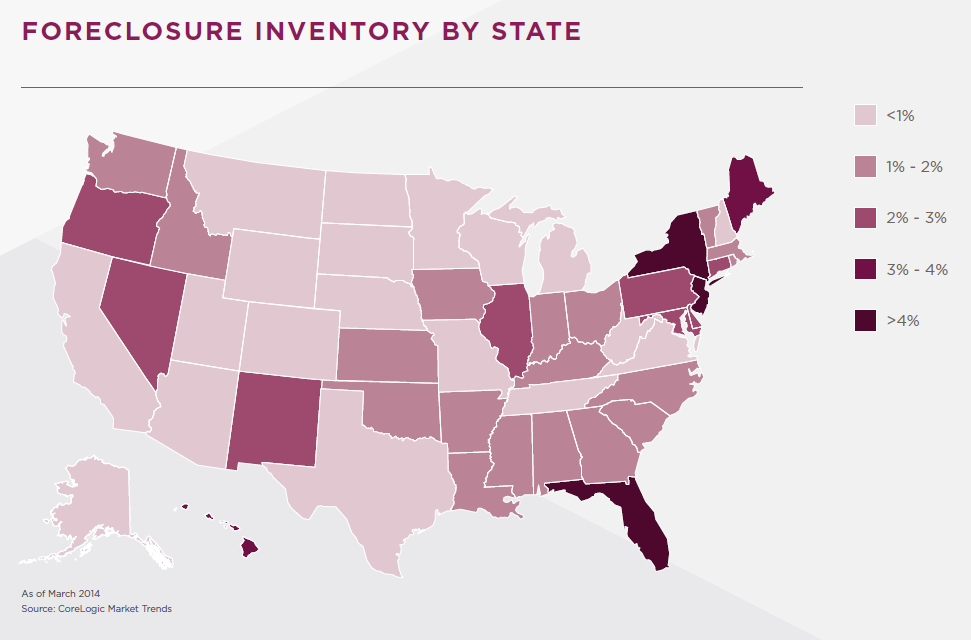
There were 48,000 completed foreclosures in March 2014, up 5.9% month-over-month but down 10% year-over-year, according to CoreLogic. Approximately 720,000 homes in the U.S. are in some state of foreclosure, compared to 1.1 million a year ago. The foreclosure inventory is largely concentrated in the judicial states of Florida, New York and New Jersey. Over the past year, the number of seriously delinquent homes fell from 2.33 million to 1.86 million.


Morning Report – Luxury building continues to perform well 5/28/14

Vital Statistics:

Last Change Percent
S&P Futures 1908.5 -0.7 -0.04%
Eurostoxx Index 3241.4 -2.9 -0.09%
Oil (WTI) 103.9 -0.3 -0.25%
LIBOR 0.228 -0.002 -0.98%
US Dollar Index (DXY) 80.49 0.139 0.17%
10 Year Govt Bond Yield 2.47% -0.05%
Current Coupon Ginnie Mae TBA 106.8 0.2
Current Coupon Fannie Mae TBA 105.9 0.2
BankRate 30 Year Fixed Rate Mortgage 4.18


Markets are flattish on no real news. Bonds continue their rally, with the 10-year bond trading at 2.47%. MBS are up as well.
Mortgage Applications fell 1.2% last week, as purchases fell 1.1% and refis fell 1.4%. The 10 year bond yield fell a basis point over the week. Refis were 52% of all loans, and ARMs are now 18.5% of the total dollar amount of loans (though only 8.4% of units, so these are mainly jumbos).
Obama has nominated San Antonio Mayor Julian Castro to lead HUD. This is more or less a political appointment, as Castro is viewed as a rising star in the Democratic Party. His confirmation in the Senate should be smooth, and the nomination should not imply any major policy changes out of HUD.
Homebuilder Toll Brothers reported second quarter numbers this morning, and it looks like things are still going swimmingly on the luxury end of things. Revenues rose 53% as deliveries increased 67% in dollar terms and 36% in unit terms. Remember, Toll Brother bought Shapell Homes, so these aren’t necessarily apples-to-apples comparisons. ASPs increased 22% (!) on a year-over-year basis to $706,000. Shapell’s footprint is affluent Coastal California, so that accounts for some of the big jump in ASPs – most other builders are reporting increases in the 9% – 12% range.
Toll CEO Douglas Yearley had this to say: “Demand over the past year has been solid, although relatively flat, compared to the strong growth we initially experienced beginning in 2011, coming off the bottom of this housing cycle. We note that last cycle’s recovery, in the early 1990s, began with a period of rapid acceleration, followed by leveling, before further upward momentum. We believe that we are in a similar leveling period in the early stages of the housing recovery with significant pent-up demand building.”
That said, the Fed is still worried about housing, as the sector continues to grow as expected. Unfortunately, the Fed doesn’t have a lot of levers to deal with the underlying issues: low household formation and tight credit. Again, all real estate is local, and the problems are mainly in the Northeast, which is still dealing with a large shadow inventory of foreclosures. In areas where this has been dealt with already (California), there is a tremendous amount of building.

Morning Report – a tale of two real estate indices 5/27/14

Vital Statistics:


  Last Change Percent
S&P Futures  1904.4 7.5 0.40%
Eurostoxx Index 3241.0 0.6 0.02%
Oil (WTI) 104.3 0.0 -0.04%
LIBOR 0.23 0.001 0.22%
US Dollar Index (DXY) 80.33 -0.065 -0.08%
10 Year Govt Bond Yield 2.54% 0.01%  
Current Coupon Ginnie Mae TBA 106.4 0.0  
Current Coupon Fannie Mae TBA 105.5 0.0  
BankRate 30 Year Fixed Rate Mortgage 4.16    


Markets are higher this morning after some good economic data. Bonds are surprisingly up. 
 
Durable Goods orders rose .8% in April and March was revised upward from 2.6% to 3.6%. The Street was looking for a drop of .7%. That said, ex-defense orders were down .8%. Ex-transportation, durable goods orders were up .1%. 
 
In other data, the Markit Purchasing Managers Index came in at 58.6, a strong number. Consumer Confidence rose to 83 in May, and the Richmond Fed Manufacturing Index was flat at 7. I think we got more economic data this morning than we got all of last week.
 
We have a couple of real estate indices this morning as well. The first is the FHFA Home Price Index, which rose .7% in March. According to FHFA, prices are back to July 2015 levels and we are within about 6% of the previous peak. We have a tremendous dispersion of strength between regions, where the Pacific division is up 18% over the past 5 years, while New England is down a couple of percent. 


The Case-Shiller index rose 1.24% for March. Prices are back to mid-2004 levels, according to the index, and are still about 20% off their peak in 2006.


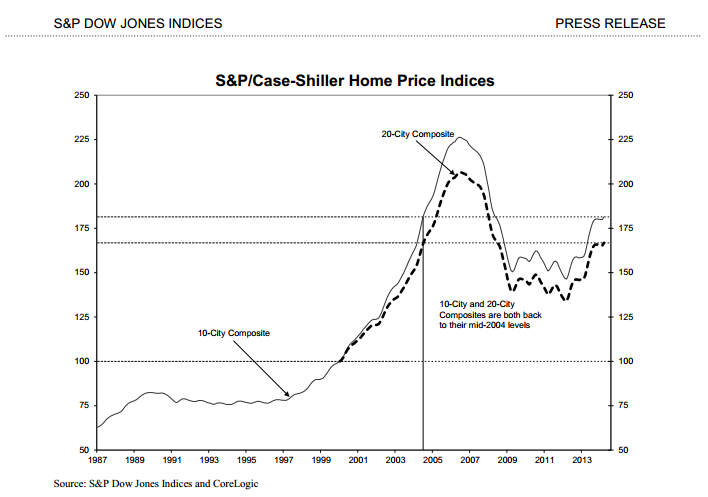
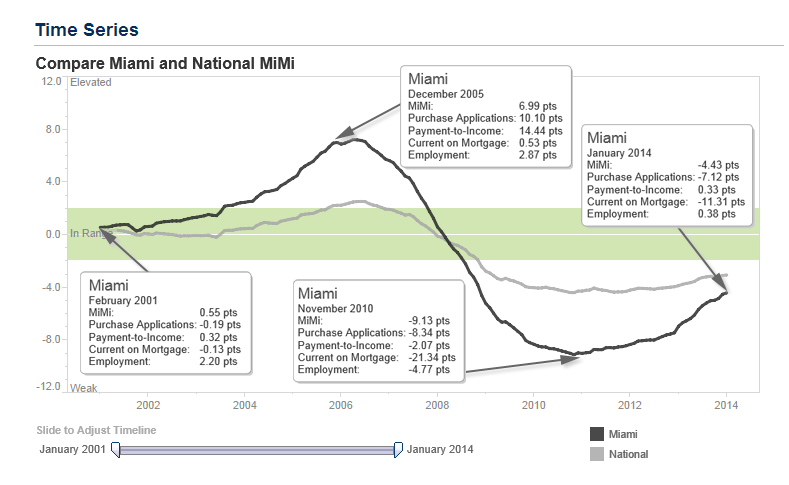
So, according to FHFA, we are within 6% of the peak and prices are at mid 2005 levels and according to Case-Shiller, we are within 20% of the peak and prices are at mid 2004 levels. Who is right? The answer is both. Case-Shiller is a broad-based index, while FHFA is narrower. The FHFA index only looks at homes with a conforming mortgage, which means it excludes jumbos and cash sales, which have been historically distressed properties, although that is changing.


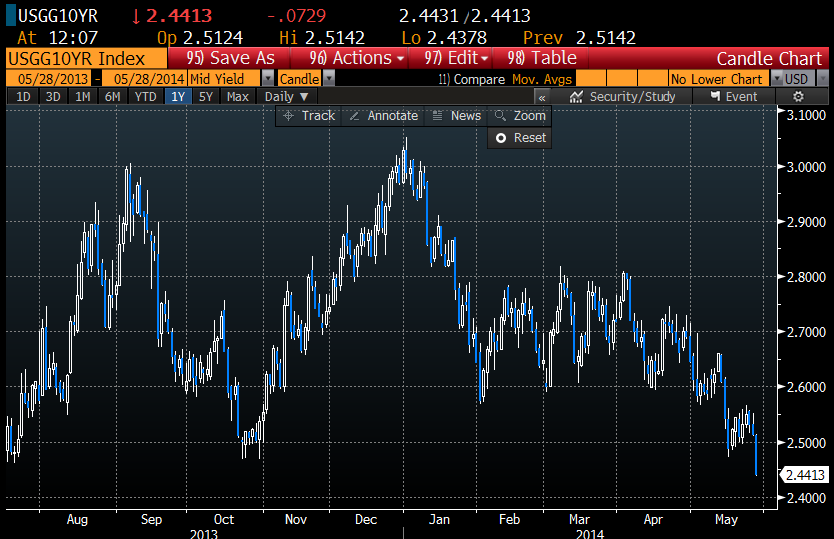
Mohammed El-Arian weighs in on what is going on in the bond market. Speculators are net short Treasuries in a big way, and pension funds are redeploying stock market gains into the bond market. That makes for a tight market. You could almost feel the stops getting triggered a couple of weeks ago when we broke out of our 2.6% – 2.8% trading range:


Always-thoughtful Gary Shilling talks about how a financial crisis in China could be the catalyst for a massive “risk-off” trade, which would mean the rally in bonds could last longer than people think. Note that mortgage REITs (one of the biggest investors in mortgage backed securities) are leaning that way.

Bites and Pieces: The Celery Edition

Hi all,

My better half recently celebrated her 13th 29th birthday. As per usual, I make a dinner in her honor and we have a friend or two over. This night, it was just the fabulous Ms. Cox. The request was for something on the lighter side, including a chilled soup. So, I went with the idea of soup, salad, a light entree and dessert. I was supposed to make a fabulous caramel corn from Bluestem (our favorite KC restaurant), but ran out of gas. I abbreviated it by making spiced nuts and serving them with a wedge of blue cheese (Rogue is fantastic for those who haven’t tried their cheeses).

Soup was easy. I planned on asparagus, but didn’t see anything I liked, so shifted to a cucumber, mint and yogurt version (Epicurious has the link). The main was easy too. Scallops have become a favorite of ours. Just get some hot oil (clarified butter is amazing), sear them, and add to a base. I planned on a mango sauce as we had a couple that were sitting around. Too long as it happens as they’d gone rotten under the skins. A roasted tomato sauce subbed nicely.

The salad is my reason for writing this post. Etto is an Italian restaurant in DC with a starter they call Celery, Celery, Celery and Walnut. The Post recently, umm, posted their recipe. This is one that takes you to $100 per person dining at a $5 per plate cost. The ingredient list is deceptively simple: celery, Chinese celery, walnuts, cheese and dressing. The Chinese variant is typically cooked, but has a great flavor. It takes a surprising amount of time to prepare, mainly as peeling celery takes awhile. It kept clogging my Oxo peeler, but was worth the wait.

Ingredients

6 – 8 celery ribs, outer side peeled and thinly sliced (about 1 cup)

1 cup chopped celery leaves from inside of the bunch (use the rest to make stock)

1 cup chopped Chinese celery

1 ½ cups chopped Chinese celery leaves

½ cup toasted and chopped walnuts


1/3 cup olive oil (use the good stuff)

1 tablespoon fresh lemon juice

1 tablespoon fresh orange juice

½ tsp. salt

½ tsp. black pepper

2 oz. pecorino Romano cheese, shaved into curls


Method

Toss it all together and have fun. I tossed the celery and leaves, whisked together the olive oiive oil, juices, salt and pepper and tossed that all together, put onto plates and topped with cheese. It can’t hurt to reserve a few of the leaves as a garnish.