Morning Report 7/3/12

Vital Statistics:

Last Change Percent
S&P Futures 1358.2 0.6 0.04%
Eurostoxx Index 2309.4 17.3 0.75%
Oil (WTI) 85.75 2.0 2.39%
LIBOR 0.461 0.000 0.00%
US Dollar Index (DXY) 81.93 0.057 0.07%
10 Year Govt Bond Yield 1.59% 0.00%
RPX Composite Real Estate Index 182.8 0.3

Markets are flat ahead of the 4th of July on a holiday-shortened day.  Bonds will close at 1:00 pm, and stocks will close at 2:00. There is very little economic data this morning.  We have the jobs report later this week and then earnings season kicks off with Alcoa on Monday.

Bob Diamond is out at Barclay’s after political pressure from the LIBOR pricing scandal forced him to resign. He will be in front of Parliament tomorrow to address questions regarding the scandal and is prepared to fight back with claims the regulators knew what was going on and didn’t object for fear the banking system would be further destabilized if the markets knew the truth.  Needless to say, the politicians are shocked to find gambling in this establishment.

The Federal Reserve Bank of San Francisco has an interesting paper on housing bubbles. Needless to say, they let the Fed off the hook, and continue with the standard academic “angels dancing on the head of a pin” argument about how to identify a bubble. But that isn’t the most interesting part of the paper. Most people know that Scandinavia experienced a massive housing bubble in the late 80s.  When it burst, many banks failed, and Sweden effectively nationalized its banking system.

However, in contrast to the Japanese experience, house prices in Norway had a V-shaped rebound and have subsequently passed their old peak by 130%. This has caused the household debt to income ratio to increase to 210%.  By way of comparison, that ratio peaked at 130% in 2007 here. If oil prices collapse and that bubble bursts, Norway will undoubtedly hit the wall. It will be interesting to see how that government reacts.  But the more interesting observation is how you can have a second bubble so soon after one bursts.

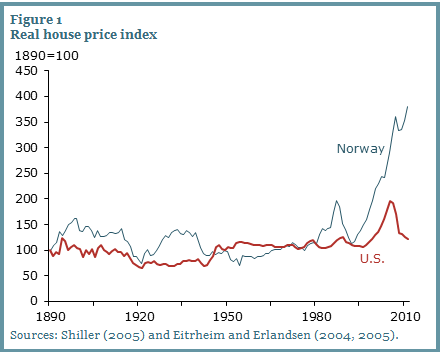
The US government is pulling out all the stops trying to put the air back into the housing bubble.  Most people assume they will fail. Norway shows that it is possible they may be able to pull it off.

Right now, all the pundits and talking heads are discussing how smart the Scandinavians have been with their “smart regulation.” and how we should emulate them. Similarly, everyone loved the US model in the late 90s and everyone thought the Japanese had cracked the code in the 80s.  Often times, the countries that are the flavor of the day just happen to be in the glory days of a bubble that will eventually burst. That prosperity is never permanent.

Have a happy 4th of July.

Morning Report 7/2/12

Vital Statistics:

  Last Change Percent
S&P Futures  1355.4 -1.0 -0.07%
Eurostoxx Index 2280.3 15.5 0.69%
Oil (WTI) 83.5 -1.5 -1.72%
LIBOR 0.461 0.000 0.00%
US Dollar Index (DXY) 81.88 0.253 0.31%
10 Year Govt Bond Yield 1.59% -0.06%  
RPX Composite Real Estate Index 182.8 0.3  

Markets are flattish after Friday’s furious rally and some disappointing economic data. Expect low volume this week as the 4th falls on a Wed. There are no major European events on the calendar this week. Bonds and currencies should close early tomorrow. The 10-year is up about point and a half and MBS are up slightly.

In another bullish sign for the real estate market, we have been seeing someone establishing a long position in the RPX futures market.

Merger Monday is back, as we have $15 billion in new deals this morning. Bristol-Myers is buying Amylin and Linde is buying Lincare. Dell has won the bidding war for Quest Software.

The ISM PMI showed contraction in the manufacturing sector – the first such reading since July of 09 – as new orders collapsed. Economists missed the number big-time, as the index came in at 49.7 vs expectations of 52. The drop in commodities prices dropped the prices paid index to 37 from 47.5.

The Markit PMI shows that manufacturing is not accelerating as the economy expands. The index fell to 52.5 from 54 in May. Remember that 50 is more or less the “zero point” and numbers below indicate a contraction in business conditions. In other words, the latest reading indicates conditions are getting better, but just barely. Weakness in Europe is being offset by stronger domestic demand.

Morning Report

Will be away for the rest of the week, so no MRs

Be back next week.

Morning Report 6/25/12

Vital Statistics:

  Last Change Percent
S&P Futures  1310.5 -16.3 -1.23%
Eurostoxx Index 2135.2 -51.6 -2.36%
Oil (WTI) 78.44 -1.3 -1.65%
LIBOR 0.461 -0.001 -0.22%
US Dollar Index (DXY) 82.51 0.250 0.30%
10 Year Govt Bond Yield 1.62% -0.06%  
RPX Composite Real Estate Index 181.4 0.2  

A soggy tape to match a soggy morning here on Wall Street. There is no real news driving futures down, just a sense of malaise coming out of watching the European slow-motion train wreck. Euro sovereigns are slightly wider, while the US 10-year is up about a point.  MBS are higher as well. 

New Home Sales came in at 369k, well ahead of expectations of 347k. That said, we are still running at levels below the bottoms of recessions going back to the 1960s and well below the average 700k pace from 1963 to the bubble burst. 


We have a lot of economic data this week, with April Case-Schiller and Consumer Confidence coming out tomorrow, Durable Goods and pending home sales Wed, Initial jobless claims and final Q1 GDP numbers on Thurs, and Personal Income / Spending numbers on Fri.  We also have a European summit (something like #18) and will potentially hear the fate of Obamacare as well.

We are in earnings pre-announcement season, where companies who are going to miss their quarters disclose it to the market. Earnings season will officially begin in two weeks with Alcoa’s numbers.

Treasury yields will hit 1% by  year end, says CNBC.  Certainly that is a possibility if nothing is done about Taxmageddon or if Europe implodes.  Simon Johnson is worried about how US banks will handle a European implosion, and even introduces a new risk we can wring our hands over:  Dissolution Risk.

The Chicago Fed National Activity Index declined to -.45 in May from +.08 in April, which indicates slowing economic growth. Positive numbers indicate the economy is growing above trend, while negative numbers indicate the economy is growing below trend. The 3 month moving average, decreased to -.34 from -.13 in May.  If the 3 month moving average falls below -.7, it typically means a recession has already begun. 

$9.3 billion.  That is the amount of money people lose per year responding to those ubiquitous Nigerian email scams.  To put that number in perspective, that is roughly what GM made last year and accounts for 11% of Nigeria’s GDP.

Morning Report 6/21/12

Vital Statistics:

Last Change Percent
S&P Futures 1351.2 0.5 0.04%
Eurostoxx Index 2220.9 13.5 0.61%
Oil (WTI) 80.75 -0.7 -0.86%
LIBOR 0.468 0.000 0.00%
US Dollar Index (DXY) 81.6 0.012 0.01%
10 Year Govt Bond Yield 1.65% -0.01%
RPX Composite Real Estate Index 180.7 0.2

Markets are flattish after a mixed Spanish bond auction and disappointing jobless claims numbers. Spain auctioned off 2.2 billion euros of 5 year debt, with a bid / cover ratio of 3:1, however it paid 6.07%.  Sovereign yields across Europe are lower, as are Treasuries with the 10 year down a basis point. MBS are up slightly.

Yesterday, the Fed maintained low interest rates and committed to extend Operation Twist through the end of the year. Notably, the Fed took down its projections for GDP growth and bumped up its estimates for unemployment. Here is a “marked up” version of the statement, showing the changes from the April release. Note that the Fed took down its numbers in spite of a massive rally in the 10-year and mortgages courtesy of Europe.

Initial Jobless Claims came int at 387k, down from a revised 389k the prior week and more or less in line with expectations. Philly Fed was a disappointment as the Business Outlook Survey indicated weaker business conditions in its area.  Rounding out the day’s economic data, May existing home sales came in at a 4.55 million annual rate, a drop of 1.5% MOM.

The FHFA House Price index was up .8% in April, while March was revised downward from + 1.8% to +1.6%. The FHFA House Price Index only considers Fannie and Freddie loans, so it acts as somewhat of a “center tendency” of the market, ignoring the high price and low price extremes. It certainly appears like the trend has shifted.  See chart below:

Software Provider Ellie Mae released its May Origination Insight Report which provides data on mortgages originated though its Encompass system. The typical closed loan had a FICO of 744, a LTV of 81, and a DTI score of 24/35.  A typical denied application had a FICO of 702, a LTV of 88, and a DTI of 28/43. The mix of refis vs purchase dropped to 54/46 from 56/44 in April and 61/39 in March, which is surprising given the drop in mortgage rates over the past 3 months. Closing times continue to increase, with the time to close up to 46 days from 42 in March. Overall, it shows a tight mortgage market with great rates for those who qualify.

On opposite ends of the economic spectrum, Octomom is getting foreclosed upon, while Larry Ellison is buying a Hawaiian Island.

Morning Report 6/20/12

Vital Statistics:

  Last Change Percent
S&P Futures  1352.0 1.4 0.10%
Eurostoxx Index 2198.5 0.5 0.02%
Oil (WTI) 84.09 0.1 0.07%
LIBOR 0.468 0.000 -0.05%
US Dollar Index (DXY) 81.24 -0.142 -0.17%
10 Year Govt Bond Yield 1.64% 0.02%  
RPX Composite Real Estate Index 180.5 0.2  

Markets are slightly firmer as Antonis Samaras looks to be sworn in as premier of the new coalition government in Greece. This is taking pressure off of Italian and Spanish borrowing rates as well. As we approach the end of the quarter, we begin preannouncement season, where companies that are going to miss their quarterly estimates fess up. Today’s victim:  Proctor and Gamble which is lowering its revenue and profit outlook on European weakness.  The earnings season officially kicks off in a couple of weeks with Alcoa announcing on July 9.

Other than Greece, markets will focus on the FOMC announcement later today, particularly with respect to Operation Twist, which is scheduled to end soon. There has been speculation that the Fed would continue Operation Twist, perhaps by buying mortgage backed securities directly instead of the 10-year. Don’t forget we have gotten 73 basis points worth of stimulation in the last 3 months courtesy of Europe, while mortgage rates have not participated fully.  That said, since the 10-year bottomed at 1.45% in early June, the underperformance has been correcting. See chart below:


The Fed is conducting Operation Twist because it wants mortgage rates down, not because it thinks the 10-year bond is too expensive. So the Fed will undoubtedly be focusing on the spread between mortgage rates and Treasuries as well as the overall level of interest rates. 

In its June Economic Outlook, Freddie Mac notes the strength in the rental market as vacancy rates fall. This is driving construction activity and Freddie estimates that multi-fam construction will add 200,000 units this year, the most since 2008. A drop in the homeownership rate is driving this demand as well as the high downpayments required for new homebuyers. Between the historically low housing starts of the last ten years (never mind population growth), the low household formation (as new grads move back in with Mom and Dad), and historic affordability we are creating pent up demand for housing that will be released into the market once the economy picks up some steam. 


Morning Report 6/19/12

Vital Statistics:

Last Change Percent
SPU2 Comdty S&P Futures 1332.5 -5.0 -0.37%
SX5E Index Eurostoxx Index 2166.7 -14.5 -0.66%
CL1 Comdty Oil (WTI) 82.89 -1.1 -1.36%
US0003M Index LIBOR 0.468 0.000 0.00%
DXY Index US Dollar Index (DXY) 81.79 0.164 0.20%
USGG10YR Index 10 Year Govt Bond Yield 1.57% -0.01%
RPX.CP28 Index RPX Composite Real Estate Index 180 0.3

Markets are slightly higher as we await the FOMC meeting on Wed. Overseas, Spain sold 3.04 billion euros worth of bills, higher than its 3 billion target. Euro sovereign yields are lower across the board, while US Treasury yields are flattish. MBS are flat. As we head into the end of the quarter, we will start to hear from companies who are going to miss earnings estimates.

Housing starts came in at a seasonally adjusted annual rate of 708k. This was below April, but was 29% over May 2011’s rate. Building Permits, which is a leading indicator for starts came in at 780k. Overall, it shows the housing market is on the mend, although new construction activity is focusing more on multi-family as opposed to single units. Housing’s contribution to GDP growth is back to slightly positive, and it is still well, well below historical averages.

Interestingly, the average housing start number for the past 10 years has been a 1.3 million annual rate.  The average annual rate from 1959 – mid 2002 was around 1.5 million / year. Pre-crisis, housing formation numbers had been running at around 1.2 million / year. This certainly helps explain the nascent demand in multi-fam construction as those people have to live somewhere, but it also suggests that a lot of the overbuilding from the bubble has been worked off.

Chart:  Housing starts 1959-Present

Morning Report 6/18/12

Vital Statistics:

  Last Change Percent
S&P Futures  1332.5 -5.0 -0.37%
Eurostoxx Index 2166.7 -14.5 -0.66%
Oil (WTI) 82.89 -1.1 -1.36%
LIBOR 0.468 0.000 0.00%
US Dollar Index (DXY) 81.79 0.164 0.20%
10 Year Govt Bond Yield 1.57% -0.01%  
RPX Composite Real Estate Index 180 0.3  

Markets are weaker this morning on a rise in Spanish bond yields, which are 34 basis points higher to 7.22%.  Over the weekend, the pro-bailout parties won in Greece, and their bond yields are a percentage point lower. US bonds are up half a point, and MBS are up slightly as well. 

Lots of economic data this week regarding housing, with NAHB today, Housing Starts tomorrow, the FOMC on Wed, and existing home sales on Friday. The NAHB index came in at 29, the highest level since May of 2007, as low rates and low prices are creating demand for home builders.  Regionally, the West and the Midwest gained, while the Northeast and the South declined.

Home equity in Q1 rose to $6.7 trillion, the highest level since 2008 as borrowers refi their mortgages and often bring cash to the table to pay down principal. In addition, many borrowers are shortening the terms of their loans. This shows part of the problem with the economy right now, as consumers save (by paying down debt). This will be good for the economy long-term, although it is a headwind now.

In another positive data point for the housing market, we have a bidding war for Rescap, GMAC’s bankrupt housing unit between Fortress and Warren Buffet. For Buffet, there a synergies between Berkadia’s servicing operations, and its Clayton manufactured housing unit. 

Morning Report 6/15/12

Vital Statistics:

  Last Change Percent
S&P Futures  1327.5 1.3 0.10%
Eurostoxx Index 2179.6 31.4 1.46%
Oil (WTI) 84.02 0.1 0.13%
LIBOR 0.468 0.000 0.00%
US Dollar Index (DXY) 81.91 -0.078 -0.10%
10 Year Govt Bond Yield 1.59% -0.05%  
RPX Composite Real Estate Index 179.8 0.3  

Markets are slightly better on speculation of further stimulus measures out of the world’s central banks. We are seeing a tightening across the board with Euro sovereigns, particularly Greece. The US 10-year is yield is lower as well, with MBS up a few ticks. Today is Triple Witching, with the expiration of options and futures. 

The Empire State Manufacturing Survey came in well below expectations, and dropped precipitously from May’s number based on a steep drop in shipments. Overall, the report suggests that business activity is still expanding (slightly) but optimism is waning. Separately, capacity utilization fell from 79.2% to 79% and industrial production fell .1%. 

Harvard’s Joint Center for Housing Studies released their State of the Nation’s Housing Market Survey yesterday. Punch line: The housing market appears to have turned the corner, however further economic weakness could stall it again. They note that housing construction is finally a positive contributor to GDP.  They also include a chart showing that the relative attractiveness of owning vs renting is as high as it has been since the early 70’s:


As if we didn’t have enough to worry about on the horizon, an ex-Soros advisor warns us about Japan, where he envisions a Japanese government bond default by 2017. The IMF is forecasting the Japanese debt to GDP ratio will increase to 245% by 2014. “The yen and the JGB market are in a bubble,” Fujimaki said. “With the gigantic debt Japan has accumulated, a thin needle, or even a gentle breeze may pop this. Events in Europe can possibly trigger this to blow up.”  While some people bemoan that we are potentially following the European track, Japan is the final stop on the track they propose.

Morning Report

Vital Statistics:

  Last Change Percent
S&P Futures  1306.1 -2.7 -0.21%
Eurostoxx Index 2134.4 -9.1 -0.42%
Oil (WTI) 82.42 -0.2 -0.24%
LIBOR 0.468 0.000 0.00%
US Dollar Index (DXY) 82.17 0.107 0.13%
10 Year Govt Bond Yield 1.59% 0.00%  
RPX Composite Real Estate Index 179.5 0.4  

Markets are weaker after Moody’s downgraded Spain to one notch over junk and initial jobless claims came in higher than expected. The chart suggests that the trend in initial jobless claims may be changing. The CPI remained muted. Bonds and MBS are slightly lower.

FHFA released its annual report to Congress on the state of the GSEs. The average 2011 mortgage in their portfolio is very high quality – Average LTV < 70%, Average FICO in the mid 70s. The worst stuff (the no-doc and IO loans are finally gone).  FHFA characterizes the GSEs as “stabilized” but not “sound.”  Fannie and Fred guarantee roughly $100 billion per month and account for 75% of every mortgage originated in 2011. They owe Treasury $187.5 billion.

The NAHB has listed 80 metro areas in their Improving Market Index for June. To be included in the index, the are must have shown improvements in housing permits, employment, and house prices for at least six consecutive months. This is a drop from May where 100 areas were in the index. Map.

The consensus seems to be that Jamie Dimon did well yesterday, by showing contrition where necessary, yet pushing back when he had to as well. The business press seems to believe the Senators went too easy on Dimon. 

In keeping with the “where is the inventory” thread I have been discussing the past few days, here is another: Private Equity has raised more than $6 billion to buy and rent foreclosed homes, yet have only deployed about $2 billion of it. Analysts are concerned that political pressure out of Washington is delaying the bulk sales. Maybe someone in Washington wants to goose the housing indices a little bit. He may end up being too clever by half – when the ducks are quacking, you gotta feed them or they go away…

Chart:  Initial Jobless Claims: