Vital Statistics:
| Last | Change | Percent | |
| S&P Futures | 1499.6 | 6.2 | 0.42% |
| Eurostoxx Index | 2645.8 | 20.6 | 0.78% |
| Oil (WTI) | 96.73 | 0.6 | 0.58% |
| LIBOR | 0.296 | 0.000 | 0.00% |
| US Dollar Index (DXY) | 79.63 | 0.075 | 0.09% |
| 10 Year Govt Bond Yield | 2.01% | 0.06% | |
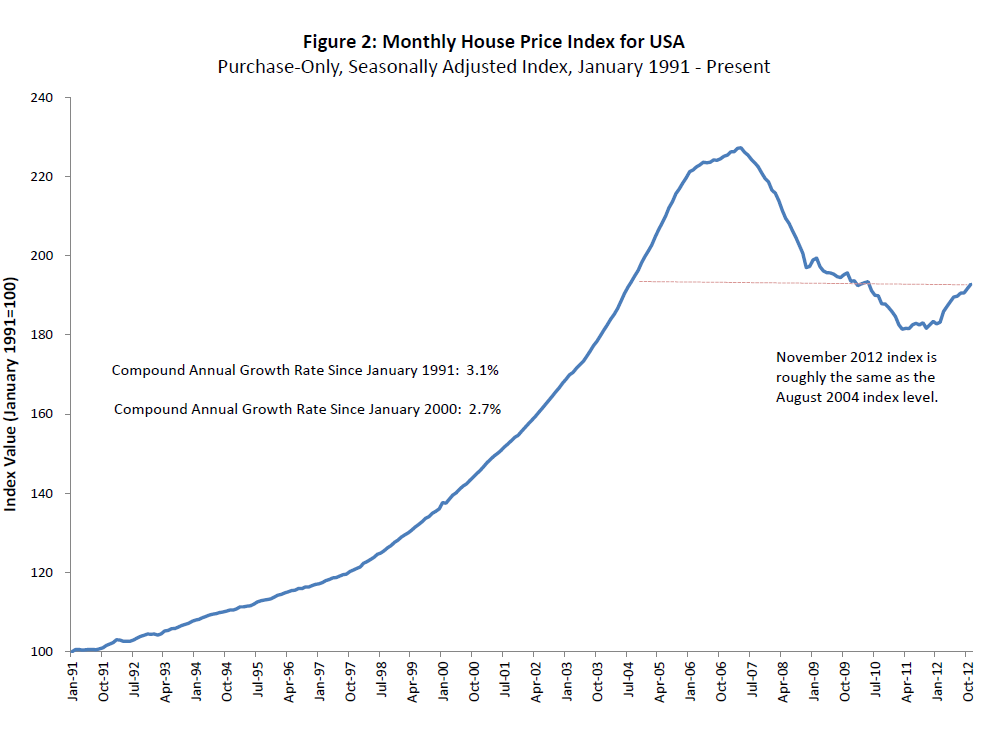
| RPX Composite Real Estate Index | 193 | -0.1 |
Markets have a better tone this morning after yesterday’s sell-off. Euro sovereign yields are down. Bond yields are at the 2% level.
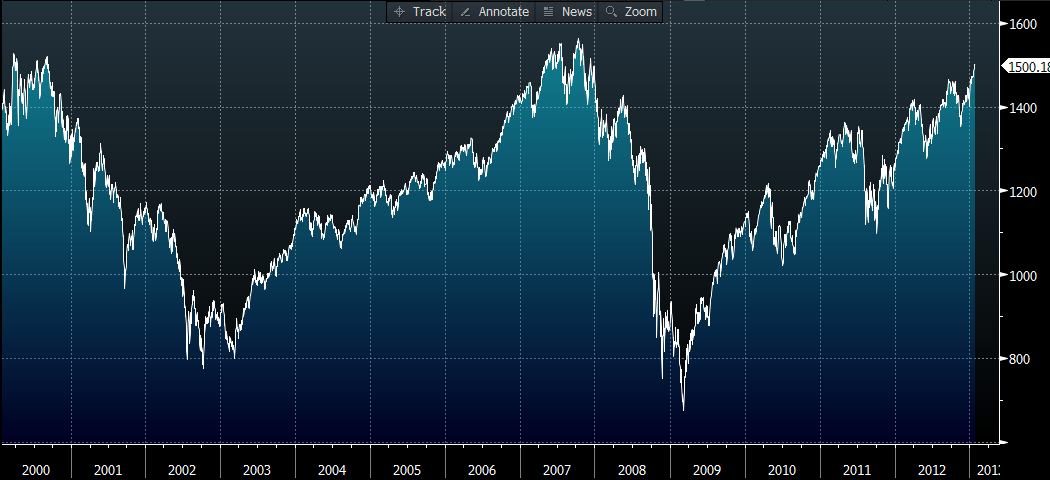
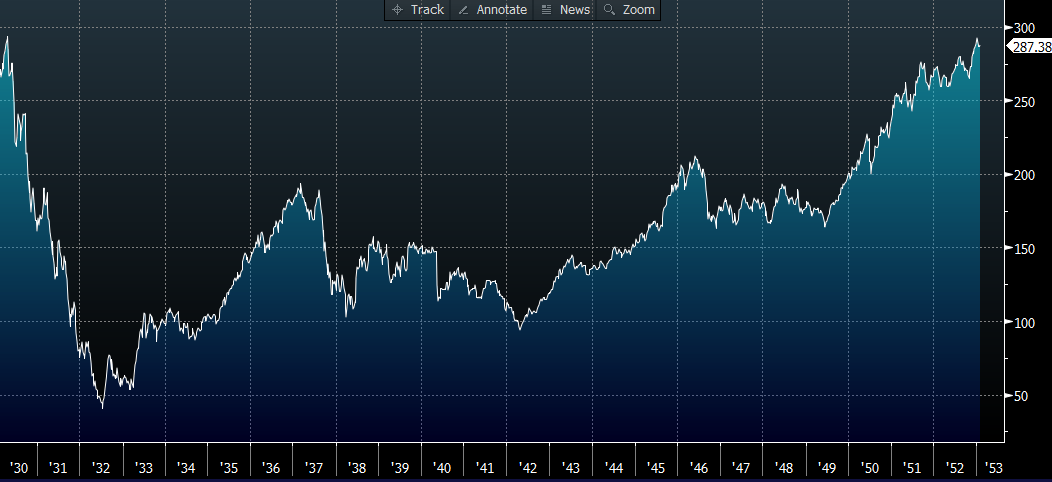
Stock index futures back up. Dell doing a $23B LBO. Retail Investors Returning. Bonds can’t get out of their own way. Is the risk-on trade happening? Feels like it. That said, the S&P 500 is nearing the top of its trading range since 2000. The 1970s bear market was a rangebound market where people would start to pile in at the top, only to have a crisis or inflation push the market back down. The final cri de coeur was Business Week’s late 1979 piece The Death of Equities. That is what secular bear markets feel like when they end. The article even quotes a very happy diamond dealer in NY after ERISA changed the laws to let institutions buy hard assets, as if CALPERS was going to start burying gemstones in the back yard.
Chart: 1970s Bear Market in Stocks.

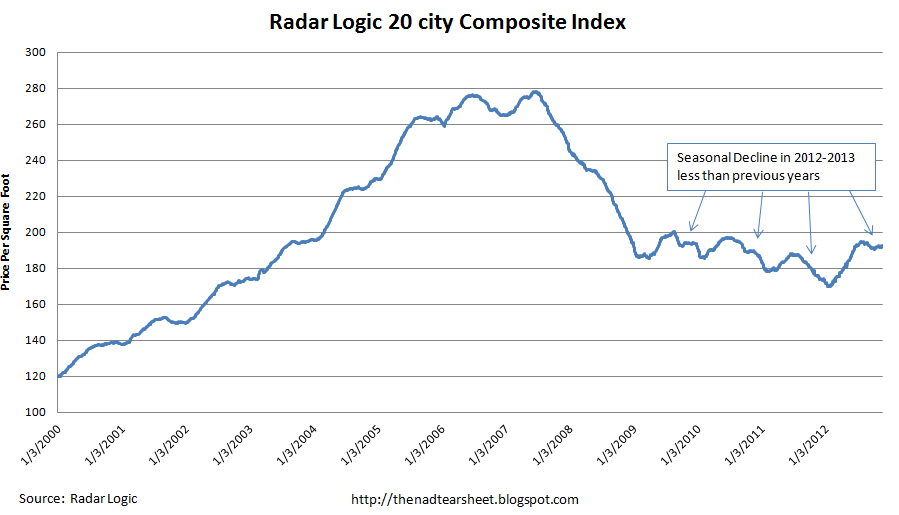
The CoreLogic Home Price Index rose 8.3% in December, the biggest jump since May 2006. Excluding distressed sales, prices increased 7.5%. They are forecasting a 7.9% YOY jump in January. The states with the biggest growth were AZ, NV, ID, CA, and HI. The worst were DE, IL, NJ, and PA. It does feel like the secular bear in real estate is over.
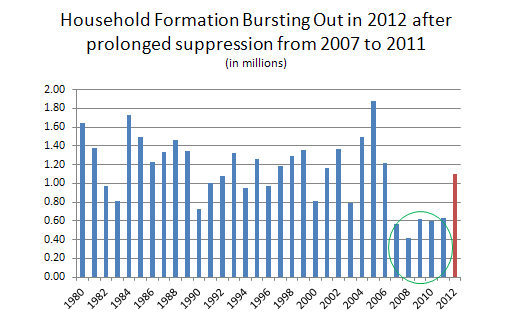
Listings of new homes has dropped to a 12-year low. For all of the fears of the shadow inventory, the problem seems to be a lack of merchandise. Many potential sellers are holding out for better prices, while professional investors are buying properties before they even hit the market. Mark Zandi of Moody’s estimates that inventories might remain tight for a year or two. Sellers are worried that they may not be able to find a replacement home if they sell. This means the homebuilders are going to have a very good year.
Senate Democrats are trying to figure out a way to delay the sequestration cuts scheduled to take effect March 1. They are looking to replace the spending cuts with a surtax on oil companies and an end to the carried interest loophole. Meanwhile, House Republicans are considering a stopgap measure that would fund the government through Sep 30, which is $974 billion, well below the current level of $1.043T. Implicit in that measure is the assumption that the sequestration cuts happen. Republicans are resigned to having to accept the sequestration cuts and don’t have the appetite to try an negotiate a deal with the WH, which is going to delay releasing its budget until late March. While it has zero prospect of getting enacted as-is, it will be a clue as to whether the President is interested in some sort of long-term solution to the budget or is content to fiddle at the margins with what is currently out there.
Filed under: Morning Report | 68 Comments »