Morning Report: Decent jobs report 11/4/16

Vital Statistics:

Last Change
S&P Futures 2085.7 2.0
Eurostoxx Index 328.9 -2.6
Oil (WTI) 44.1 -0.6
US dollar index 87.7 0.0
10 Year Govt Bond Yield 1.79%
Current Coupon Fannie Mae TBA 103
Current Coupon Ginnie Mae TBA 104
30 Year Fixed Rate Mortgage 3.61

Stocks are higher after a decent jobs report. Bonds and MBS are up as well.

Jobs report data dump:

  • Payrolls increased by 161,000
  • Unemployment rate 4.9%
  • Labor Force Participation rate 62.8%
  • Average hourly earnings 0.4%

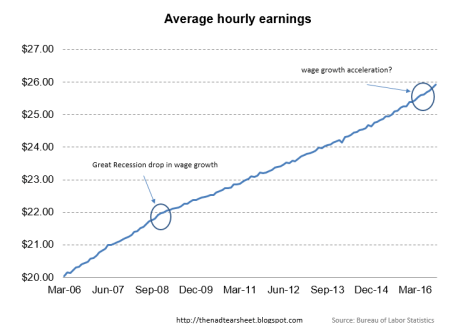
The payroll data was disappointing, as was the decrease in the labor force participation rate. The plus side was wage growth, where wages rose at a 2.8% annual rate, the biggest increase since 2009. The employment to population ratio slipped to 59.7%. Basically, it looks like the number of unemployed fell, however they didn’t get jobs – they exited the labor force. Below is a chart of average hourly earnings. You can see the slope of the line decrease in 2008 as the Great Recession began and wage growth slipped from its bubble year growth rate of 3.3% to 2%, where it largely stayed during the recovery. It appears like the slope of the line is beginning to increase, which solves a lot of problems in our economy. Too early to tell if it is a trend, though. Bottom line: This gives the Fed all the ammo they need to raise the Fed Funds rate next month. FWIW, the Fed Funds futures are now assigning a 80% chance of a 25 basis point hike next month.

hourly-earnings

Ordinarily, this report would be bond bearish, however global sovereigns are rallying and pulling the 10 year along for the ride.

Ex Dallas Fed Head Richard Fisher blames the rise of Donald Trump partially on Fed policy. The Fed’s policy of driving interest rates to the floor and flooding the system with money to support asset prices is great news for people who own real estate and stocks, however for those that save it has been terrible:

“Global monetary policy has “skewered the middle-income groups, the ‘middle class,’ adding to the angst that has sprung from their sense of an overbearing, intrusive central government….Small wonder that we have ended up at a political crossroad, with a choice for the presidency between a candidate who advocates having government distribute still more to ease the pain and another arguing to provide relief by changing gears entirely, though we know not how, when or where…My more acerbic friends on both sides of the aisle consider it a Hobson’s choice,” he said, referring to a situation where it seems there’s free choice but in reality there’s no good alternative. On the one hand, Republicans believe the other party’s candidate is channeling Eva Peron, planning policies that will ultimately lead us down the Argentine path to economic ruin while basking in personal profit and glory. On the other, Democrats liken the Republican candidate to Caligula.”

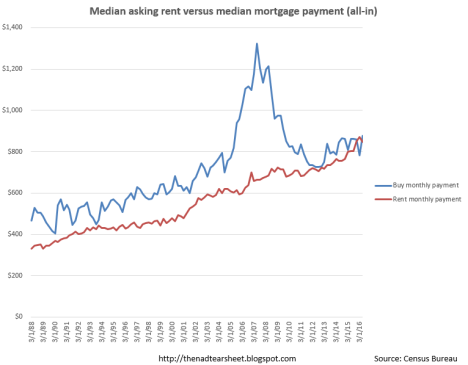
On the subject of QE, he is spot-on. QE and unconventional monetary policy has certainly increased inequality, and made life tough if you are a renter. Rental inflation is increasing at a 4% annual clip, and as we saw above, wages are well below that. QE has been great for the landlord, but not the tenant. I find it amazing that the Fed gets a free pass in the media and from the political class on the subject of inequality.

For all the sturm and drang regarding how markets will react to a Trump presidency, bond traders appear to be relatively sanguine. Just like stocks have the VIX index which measures fear indirectly by tracking the price of options, bonds have an index too. And it is close to yearly lows.

Morning Report: The Fed stands pat 11/3/16

Vital Statistics:

Last Change
S&P Futures 2096.8 5.0
Eurostoxx Index 333.8 0.7
Oil (WTI) 45.5 0.1
US dollar index 87.8 0.0
10 Year Govt Bond Yield 1.82%
Current Coupon Fannie Mae TBA 103.3
Current Coupon Ginnie Mae TBA 104.2
30 Year Fixed Rate Mortgage 3.64

Stocks are mixed this morning after the Fed maintained interest rates. Bonds and MBS are down.

The Fed maintained interest rates at current levels yesterday. The meat of the statement: The labor market continues to strengthen, household spending is improving while business spending remains a weak spot. Inflation is ticking up but remains below the target rate. Esther George and Loretta Mester dissented, wanting to hike at this meeting. Bonds rallied maybe a basis point on the statement.

This morning the Bank of England said that it doesn’t plan on cutting interest rates this year, which is causing a global sell-off in sovereign debt.

Announced job cuts fell 31% to 30,740 according to outplacement firm Challenger Gray and Christmas. This report looks at press announcements of job cuts, which may or may not ever materialize. Regardless, it does make the case that companies are holding onto their workers. In fact, this was the lowest October since 1999. Job cuts were most in the computer industry (largely related to HP), while cuts in the energy patch are slowing down considerably from earlier this year.

Initial Jobless Claims ticked up to 265k last week, which is still an extraordinarily low number. Separately, the Bloomberg Consumer Comfort Index ticked up.

The ISM Non-Manufacturing Index dropped to 54.8 from 57.1 in September. This means the service economy is growing, however growth is decelerating. Transportation and Construction is leading the charge, while mining and educational services are lagging.

Productivity broke out of its long slump with a 3.1% increase in the third quarter. Output increased 3.4% and unit labor costs increased 0.3%. Increasing productivity is good news as it means wages can increase without generating inflationary pressures. Productivity has been disappointing ever since the economy bottomed, however.

Both Republicans and Democrats look back wistfully on the 50s and the 60s. These years were an economic glory time, where unemployment was extraordinarily low, jobs were plentiful and high paying, and a single income was sufficient to support a family. The Third Quarter of the 20th Century basically began with the end of the Korean War and concluded with the oil shocks of the early 70s. Both parties want to bring back those times. Is that realistic? Probably not. The postwar decades were an extraordinary period where the US had no international competition, and not only had to satisfy its own demand, it had to satisfy the demand of Europe and Asia. The US earned what economists call “economic rents” and they were split between organized labor and government. By the late 70s, Europe was back on its feet and both old and new competitors were emerging from Asia. These economic rents were competed away (as they inevitably are). While this was good news for consumers and stockholders, it was bad news for union workers in general. Anyone who wants to bring back the salad days of the 50s and 60s needs to come up with a plan to get Angela Merkel to invade Poland. Donald Trump’s vision of pre-free trade America won’t get you there. Neither will the left’s vision of an “smart” paternalistic regulatory state and 90%+ marginal tax rates.

Morning Report: Construction Spending Falls 11/2/16

Vital Statistics:

Last Change
S&P Futures 2102.0 -2.0
Eurostoxx Index 333.6 -2.0
Oil (WTI) 46.0 -0.6
US dollar index 88.6 0.0
10 Year Govt Bond Yield 1.82%
Current Coupon Fannie Mae TBA 103.3
Current Coupon Ginnie Mae TBA 104.2
30 Year Fixed Rate Mortgage 3.62

Stocks are mixed ahead of the FOMC decision today. Bonds and MBS are up.

At 2:00 pm we will get the FOMC rate decision. Given the sensitivity around the election, I would imagine the Fed wants to be as far in the background as possible. I would be looking for a statement that is pretty much identical to the Sep statement.

Mortgage Applications fell 1.2% last week as purchases fell 0.4% and refis fell 2%. The 30 year fixed rate mortgage increased 4 basis points.

The ADP jobs report is forecasting a lousy jobs report on Friday. Payrolls increased 147k versus the 170k expectation. The Street is looking for 178k jobs to be reported on Friday.

The Atlanta Fed has lowered its forecast for Q4 GDP to 2.3%. They were previously looking for 2.7%. They are looking for softer consumer spending and business investment.

Construction spending fell 0.4% MOM and 0.2% YOY in September. Total construction spending was $1.15 trillion. Private construction fell 0.2% while public construction fell 0.9%. Residential construction was the bright spot however, as it increased 0.4%. Construction spending as a percent of GDP is still rather depressed compared to historical numbers. Yet another example of how housing continues to punch below its weight.

construction-spending

One thing that has been a partisan bone of contention has been public construction. The Obama administration has been pounding the table that we need to spend money on public construction in order to “rebuild our crumbling infrastructure” and put people to work in order to stimulate the economy. Let’s set aside the argument over whether there is a multiplier effect for government stimulus plans (there isn’t). Have we been spending on public construction (infrastructure)? Ultimately, it looks like there is merit to the argument that we have let things slide. Aside from the early Obama administration stimulus bump, it is sliding to new lows as a percentage of GDP. Note that both Hillary and Trump are in favor of a big push for public works spending. Note however that private construction is over 3x the amount of public construction. So if you want the economy to really grow, the juice is in private construction, not public construction. Unfortunately, the lack of private construction is simply not on the radar in Washington. Politicians and regulators should be asking themselves whether they are an impediment to private construction spending. The answer to that question will undoubtedly fall along partisan lines.

public-construction-of-gdp

Banks are no longer the biggest mortgage lenders in the US. Nonbanks like PennyMac and Quicken are making the loans that banks no longer want to make. We have seen the banks back away from FHA loans after being slugged too many times by the regulators. “It’s becoming the perfect storm—when you punish banks, [they] don’t lend out money,” said Paul Miller, an analyst at FBR Capital Markets. “Banks are becoming utilities that are unable or unwilling to play with risk.” Of course that is exactly the vision of the Elizabeth Warrens of the world: to turn banks into public utilities that earn a nominal rate of return and are effectively controlled by the government. The biggest worry is that if times get tough, nonbanks have less access to capital than banks which could severely restrict credit.

Morning Report: Credit explains tight inventory 11/1/16

Vital Statistics:

Last Change
S&P Futures 2124.8 5.0
Eurostoxx Index 338.3 -0.7
Oil (WTI) 47.1 0.2
US dollar index 88.3 -0.2
10 Year Govt Bond Yield 1.87%
Current Coupon Fannie Mae TBA 103
Current Coupon Ginnie Mae TBA 104
30 Year Fixed Rate Mortgage 3.62

Stocks are higher as the FOMC begins its November meeting. Bonds and MBS are down.

The PMI Manufacturing Index improved in October to 53.4 from 51.1. We are starting to see increases in input prices be passed through to customers.

The ISM Manufacturing Index ticked up to 51.9 from 51.6.

Bonds had their worst October in 2 years as European bonds slid on bets that there will be no further stimulus out of the ECB. US bond yields are going to be naturally pulled in the direction of overseas bonds absent any info coming out of the US. If the global economy is truly out of the woods, then the path of least resistance for bonds is down, which means gradually increasing interest rates going forward. However, if the Chinese economy blows up as asset prices fall, then all bets are off.

The FOMC meeting begins today and we will get the announcement tomorrow. The markets are assuming that we will have no change in monetary policy at this meeting. The Fed Funds futures are assigning a 71% probability of a 25 basis point hike in the Fed Funds rate at the FOMC meeting in December. That said, we could see some volatility around the statement tomorrow afternoon if they deviate from the script (which probably isn’t going to happen 1 week before the election).

Home prices rose 1.1% MOM and 6.3% YOY according to CoreLogic. Home equity wealth has doubled over the past 5 years to $13 trillion. This works out to be about $11,000 per homeowner, however the geographic split is pretty wide. In September, CoreLogic reported that 112 markets are overvalued, with 19 of them in Texas. The heat map is shown below, where red = overvalued and green = undervalued.

corelogic-msas

Part of what is driving home prices into overvalued territory is supply, and as we know, builders are adding to inventory only grudgingly. What is going on? Ultimately credit is a big driver, but not at the residential mortgage level, it is at the bank level. There has been a huge bifurcation in credit over the past several years, where big builders like D.R. Horton or Lennar can access the bond market at very favorable rates, while the smaller builders are having trouble getting loans from their local bank. In addition, most of the lending has gone to multi-fam, not single fam. Second, lack of skilled labor and land are playing a part. The skilled labor part will fix itself on its own as high wages attract more people to the business. Land is a more difficult issue, however the price differential between the exurbs eventually will win out.

If Halloween candy were bonds:

haloween candy.PNG

Morning Report: Inflation remains below the Fed’s target 10/31/16

Vital Statistics:

Last Change
S&P Futures 2126.3 2.5
Eurostoxx Index 339.5 -1.3
Oil (WTI) 48.2 -0.6
US dollar index 88.8 0.1
10 Year Govt Bond Yield 1.84%
Current Coupon Fannie Mae TBA 103
Current Coupon Ginnie Mae TBA 104
30 Year Fixed Rate Mortgage 3.62

Markets are up on earnings and merger mania. Bonds and MBS are down.

Personal Incomes rose 0.3% in September, which was a little below expectations. Consumer spending rose 0.5%, which was in line with expectations. Core PCE inflation – the number the Fed uses to measure inflation – rose 1.7% YOY, so we are still below the 2% target.

The Chicago PMI Index fell to 50.6 from 54.3.

The FBI re-opened the email investigation on Hillary late Friday night. Democrats are attacking Comey (who just went from hero to goat). This will take until mid-week to be fully reflected in the polls, and the pundits will be watching polls in VA and NC closely.

IMO, regardless of who wins, gridlock will be the result, unless Democrats sweep. So more of the same. I don’t see much of an effect happening in either interest rates or stock prices. The Fed is much more influential than who occupies the WH.

Home prices are up 0.3% MOM and 5.3% YOY, according to Black Knight Financial Services. The index now stands at $266k, which is 0.7% below the 2006 peak of $268. The report has good state-by-state info, so check it out.

Banks continue to hoard Treasuries, and are tightening credit to business. Deposit growth is outstripping loan demand, which is the biggest reason. As the US savings rate increases, consumer spending is affected. Part of this is demographics: The baby boom is retiring and will inevitably cut spending, while the Millennials have yet to make any real money and start spending.

Morning Report: Strong headline GDP number 10/28/16

Vital Statistics:

Last Change
S&P Futures 2127.5 4.0
Eurostoxx Index 340.8 -0.9
Oil (WTI) 49.2 -0.6
US dollar index 88.9 0.0
10 Year Govt Bond Yield 1.85%
Current Coupon Fannie Mae TBA 103
Current Coupon Ginnie Mae TBA 104
30 Year Fixed Rate Mortgage 3.58

Stocks are higher this morning as earnings reports pile in. Bonds and MBS are flat.

The first estimate of Q3 GDP came in at +2.9%, which was higher than expected. Inventory and exports drove the increase. This is a sharp rebound after 3 extremely weak reports. Disposable personal income rose 3.6% and the savings rate was flat at 5.7%. This number will be revised at least once before the December Fed meeting.

gdp

Inventories and exports are not great indicators of domestic demand, however and that is what really drives the economy. If you strip those two things out, you can see that demand increased, but it wasn’t the blockbuster number that the headline GDP print suggests. This helps explain why GDP growth can be 2.9% (which is a robust expansion) and not feel like it. Consumer spending decelerated in Q3 from 4.3% to 2.1%. Back-to-school numbers for the retailers were disappointing, and this number bears that out.

gdp-ex-inventory-and-trade

Employment costs rose 0.6% in the third quarter as comp increased 0.5% and benefits increased 0.7%. Judging by the increase in Obamacare insurance premiums, benefit cost inflation will continue to increase the costs of employees which will act as a damper on wage growth.

Pending home sales increased 1.5% in September, according to the NAR. According to NAR Chief Economist Lawrence Yun, tight inventory remains a problem: “The one major predicament in the housing market is without a doubt the painfully low levels of housing inventory in much of the country…It’s leading to home prices outpacing wages, properties selling a lot quicker than a year ago 2 and the home search for many prospective buyers being highly competitive and drawn out because of a shortage of listings at affordable prices.” Of course this means the ratio of house prices to income is getting stretched. Wage inflation is needed to maintain these prices.

The US 10 year has gotten hammered over the past month. What is going on? Economic data has generally been soft (today’s GDP report notwithstanding). IMO, we are in the middle of a correction in global bonds. Using the German Bund as proxy for global bonds, you can see that yields have backed up in a big way over the past month. US Treasuries may not necessarily be rising ahead of the December GDP report and may simply be correlating with bond yields overseas. Note that the yield is higher than it was pre-Brexit.

bund-yield

Morning Report: Wages and assets 10/27/16

Vital Statistics:

Last Change
S&P Futures 2142.4 9.0
Eurostoxx Index 341.9 0.1
Oil (WTI) 49.3 0.1
US dollar index 88.7 0.0
10 Year Govt Bond Yield 1.84%
Current Coupon Fannie Mae TBA 103
Current Coupon Ginnie Mae TBA 104
30 Year Fixed Rate Mortgage 3.58

Back from the MBA conference in Boston. The main chatter was about Ginnie’s new plan to discourage the serial VA IRRRL shops. Consensus is that it will work because it will decimate the margins on these loans. The prepay speeds on VA loans have gotten so high that Ginnie Mae servicing prices are being affected.

Separately, Richard Cordray took aim at servicers at the conference.

Let’s get caught up on economic data.

Durable Goods orders fell 0.1% MOM in September. Business capital expenditures fell 1.2% MOM and are down 4.1% YOY. Some of that has been due to the strength in the dollar, and continued fallout from energy prices.

The Chicago Fed National Activity Index improved to -.14. The 3 month moving average (the number to look at) is still negative at -.21, which means the economy is growing below trend. When the 3 month MA drops below -.7 that is a recessionary signal.

Home prices continue to rise according to the FHFA. Prices increased 0.7% MOM and 6.4% YOY in August. Prices are now about 5% higher than the peak 2006 levels. Note that this is a subset of all homes (only those with conforming mortgages) but it is a good estimate for the “middle of the plate” housing in the US.

Separately, Case-Shiller was up 0.2% MOM and 5.1% YOY.

New Home Sales came in a little lighter than expected, up just under 600k, however July and August were revised sharply downward. The South performed best, while the West performed the worst. Take the Census numbers with a grain of salt, however. The sample sizes are small and therefore the confidence intervals around those numbers are very wide. Homebuilder earnings usually tell the story a bit better.

Mortgage Applications fell 4% last week as purchases fell 7% and refis fell 2%. Purchase activity is still up smartly YOY, however refis are at the worst levels since June.

Initial Jobless Claims came in at 258k, which is a quite strong number.

Wages are increasing for skilled labor, especially in construction. Below is a chart plotting annual wage growth for manufacturing and construction labor. Construction labor wage inflation is back to the bubble years, and manufacturing wage growth is approaching those levels as well.

construction-wage-growth

Ultimately this is good news for the economy. Wage growth has been a disappointment in this recovery. This probably isn’t great news for homebuilding stocks (the SPDR homebuilder ETF XHB is down about 13% over the past 6 weeks), and is probably not great news for manufacturers either. That said, the elephant in the room is the Fed. Does this push the Fed to hike more aggressively than forecast? Given how many times the Fed has gotten cold feet already, and the fact that unskilled labor remains in a glut, I don’t think so. Janet Yellen has said the Fed will let the labor market run hot for a while in order to bring back some of the long term unemployed.

In the same article, Joe Lavorgne of Deutsche Bank has a chart that is a bit more worrisome, which looks at the ratio of household net worth to disposable income. We are back at levels associated with the stock market bubble peak and the residential real estate bubble peak. Taking this chart at face value you would probably conclude that asset prices are in bubble territory, which is definitely the case for sovereign debt. However, if wage growth is accelerating, then the ratio will fall going forward, for the right reason. However if wages continue to stagnate, then yes we could be vulnerable to a sell-off in asset prices.

household-net-worth-over-income

Morning Report: More rent versus buy 10/21/16

Vital Statistics:

Last Change
S&P Futures 2124.7 -12.0
Eurostoxx Index 343.3 -1.0
Oil (WTI) 50.3 -1.3
US dollar index 88.6 0.0
10 Year Govt Bond Yield 1.74%
Current Coupon Fannie Mae TBA 103.3
Current Coupon Ginnie Mae TBA 104.2
30 Year Fixed Rate Mortgage 3.57

Stocks are lower this morning on no real news. Bonds and MBS are up.

No economic data today, however we do have some Fed-speak.

Following on yesterday’s rent-versus-buy article from Trulia, I crunched some numbers to demonstrate the relative value proposition currently. Using census data for median asking rent and median house prices, I plotted the median asking rent against the mortgage payment for a FHA loan with 3.5% down, including mortgage insurance, property taxes, homeowner’s insurance, and the tax benefit of deducting interest and property taxes for a borrower making the median income. Historically, buying has resulted in a payment higher than the median rent payment. This makes sense: your mortgage payment will be more or less fixed, while rent will increase with inflation.

The chart below plots the two numbers in absolute dollars. You can see the two lines converging which means the rent-versus-buy decision is about as far skewed towards buying than it ever has been.

rent-vs-buy-graph

In the second chart, I plotted the difference between the “median” mortgage payment and median asking rent. The range recently has been anywhere from -10% to 100%.

rent-vs-buy-percent

The other thing to keep in mind with the rent vs buy decision is that the world’s central banks are on a mission to create inflation. They will eventually succeed, and over time the asking rent is going to increase, while the mortgage payment will be largely fixed, with the exception of property taxes and perhaps homeowner’s insurance. On the other side of the coin, home price appreciation will probably maintain at least a mid-single digit rate of appreciation, which is higher than the mortgage interest rate, especially when you take into account the tax benefits.

The takeaway is that the Fed is giving the homeowner a gift in low rates, and that won’t last forever.

Morning Report: Buying is still a better deal than renting 10/20/16

Vital Statistics:

Last Change
S&P Futures 2135.3 -3.0
Eurostoxx Index 341.6 -2.0
Oil (WTI) 50.7 -0.9
US dollar index 88.0 0.0
10 Year Govt Bond Yield 1.75%
Current Coupon Fannie Mae TBA 103.3
Current Coupon Ginnie Mae TBA 104.2
30 Year Fixed Rate Mortgage 3.57

Stocks are lower this morning after ECB President Mario Draghi said the ECB is not looking at doing more QE after the program ends in March. Bonds and MBS are up.

In economic data this morning, initial jobless claims rose 13k to 260k. Separately, the Bloomberg Consumer Comfort Index fell. The Philly Fed manufacturing index improved in September, but manufacturing has generally been weak across the board as the stronger dollar hurts competitiveness overseas.

Existing Home Sales rebounded in September to an annualized pace of 5.47% from a downward-revised pace of 5.3 million in August. The median home price was up 5.6% to $234,200. The first time homebuyer represented 34% of all sales, which is a big improvement from the 30% – 32% range it had been stuck in for the past year. Inventory remains tight, however with about 2.05 million homes on the market, which represents a 4.5 month supply. A balanced market is closer to 6.5 months. Distressed sales (foreclosures and short sales) represented 4% of all sales, which is a post-crisis low. Days on market ticked up to 39 days from 36 in August. The increase in the first time homebuyer is definitely good news, and we may finally be seeing the pent-up demand that has been building over the past 10 years finally come to market.

In spite of all that pent-up demand, housing starts remain anemic given where we are in the economic cycle. Housing construction has been the missing link this whole recession. Note the shaded grey areas on the chart. Those are recessions. See how housing construction historically experienced a sharp rebound after the economy bottomed? We haven’t seen that this time around. Some of that was due to an overhang of inventory from the bubble years that needed to be sold, however that adjustment was made by 2011 or so. Since then, tight inventory and rising prices have been the story. The reason why this recovery has been so tepid has been the absence of a robust housing construction market.

housing-starts-fred

Note that Fannie Mae thinks that housing construction will remain muted. In their latest Economic Commentary, they forecast housing starts will grow to about 1.3 million in 2017, which is about 12% higher than their forecast for 2016. The bright spot? SFR will increase to 15% to an annualized pace of 883k. SFR will cannibalize multi-fam going forward as the economy improves and more Millennials go from being renters to being buyers. Speaking of which…

Trulia has a good piece out on the advantages of buying versus renting. Buying a home is 37% cheaper than renting nationally. Naturally, the advantage differs from market to market, but even the worst markets for buying are still 17% cheaper. This assumes the buyer puts down 20% and stays in the house for 7 years. The advantage was as high as 41% in 2012, and got as low as 34% in 2014. Of course this is a moving target as mortgage rates and house prices change. Where are the tipping points to flip the relationship? For home prices, it is a median house price of $468k. For mortgage rates, it is 9.1%.

trulia-rent-vs-buy

Morning Report: Housing starts disappoint 10/19/16

Vital Statistics:

Last Change
S&P Futures 2137.5 4.0
Eurostoxx Index 343.1 0.6
Oil (WTI) 51.1 0.8
US dollar index 88.0 0.0
10 Year Govt Bond Yield 1.76%
Current Coupon Fannie Mae TBA 103.3
Current Coupon Ginnie Mae TBA 104.2
30 Year Fixed Rate Mortgage 3.57

Stocks are up this morning as earnings reports continue to pile in. Bonds and MBS are flat.

Mortgage Applications rose 0.6% last week as purchases rose 3% and refis fell 1%.

Housing starts fell to a 1.05 million pace in September, driven by a big drop in multi-fam. Single fam was up around 8%. Building Permits rose to 1.23 million. Housing continues to be the biggest underperformer in the economy, but the subject hasn’t really come up in this election, for either side.

We have some Fed-speak today, with John Williams speaking at 8:45, Rob Kaplan at 1:30 and William Dudley tonight.

The final debate is tonight, and it looks like Hillary is pulling away from Trump at this point. The black swan event for the markets is a Democratic Party sweep, which will probably cause the stock market to spit up a hairball.

Lending standards in the jumbo space are loosening, even as the luxury end of the housing market underperforms. Loan Depot is now offering 40 year jumbo products that are interest-only for the first 10 years. Redwood is now offering a 90 LTV product that goes down to a 660 FICO.

The NAR is releasing its latest Profile of Home Buyers and Sellers. Here are the big changes over the past 35 years.

  • The first time homebuyer is a smaller percentage than it has been in the past.
  • The internet is not replacing the real estate agent
  • Houses have been getting bigger of the past 30 years, but have leveled out in recent years
  • Down payments have been going down
  • The home search process is taking longer than ever due to tight inventory

Zillow has their own report on trends in housing. Here is the executive summary (the report is very long and detailed):

“The home buying experience is both an intimidating financial transaction and an emotional milestone. Half of home buyers in the U.S. are under 36, meaning a new generation— Millennials—is shaping the future of real estate. Despite demographic reports about young adults’ urban lifestyles, Millennials share their parents’ aspirations for a single-family home, often in the suburbs.

The process of finding or selling a home is much more collaborative for Millennials than for older generations. They bring all available tools to the process, including their smartphones, social media and online networks. While older generations rely on real estate agents for information and expertise, Millennials expect real estate agents to become trusted advisers and strategic partners.

Millennial home buyers are also diverse. While only 9 percent of all homeowners are Hispanic, nearly 15 percent of the Millennials buying homes are Hispanic—reflecting the changing demographics of the American middle class.

Homeownership remains a vehicle for wealth in the U.S., but it can also be a financial burden, as families stretch their finances to afford the space they need, and large, dated homes owned by Baby Boomers and the Silent Generation demand maintenance and improvements.”