Morning Report: New home sales still anemic historically

Vital Statistics:


Last Change
S&P futures 2821  9
Eurostoxx index 380.4 1.8
Oil (WTI) 58.12 -0.14
10 year government bond yield 2.60%
30 year fixed rate mortgage 4.28%


Stocks are higher this morning on overseas strength, particularly in China and Japan. Bonds and MBS are up.


New Home Sales fell to 607,000 in January, according to the Census Bureau. This is down 7% MOM and 4% YOY. New Homes Sales is a notoriously volatile number, and the margin for error is generally in the mid-teens %. Still 607,000 is roughly in line with historical averages over the past 50 years. That said, population has grown since then, so it isn’t really comparable. Take a look at the chart below, which is new home sales divided by population – we are still only at levels associated with the depths of prior recessions. In other words, we are still in very early innings with the housing recovery, and you can make an argument that the recovery hasn’t even begun yet.
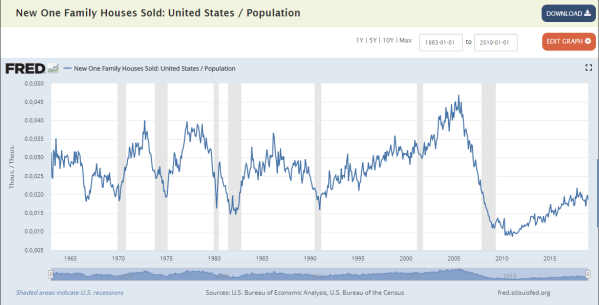
 

new home sales divided by population


Industrial Production rose 0.1% in February, and January’s initial 0.6% drop was revised upward to -0.4%. Manufacturing production fell 0.4%, while January’s 0.9% drop was revised upward to -0.5%. Capacity Utilization fell to 78.2%, while Jan was revised up again. So, Feb wasn’t great, but January wasn’t as bad as it initially appeared to be.


We have entered the quiet period for the Fed ahead of their meeting next week. No rate hikes are expected, although we will get new economic forecasts and a new dot plot. Sentiment regarding the Fed has changed massively over the past few months. As of now, the the Fed funds futures are estimating that there is a 75% chance the Fed does nothing this year, and a 25% chance they cut rates by 25 basis points. The fed funds futures are pricing a 0% chance of a hike. While Trump’s jawboning of the Fed was bad form, and you generally don’t want to see presidents doing that, you also can’t escape the fact that the Fed Funds futures and the markets think he was right!

Morning Report: Real Estate and economic cycles

Vital Statistics:


Last Change
S&P futures 2815 -4
Eurostoxx index 377.4 1.8
Oil (WTI) 58.12 -0.14
10 year government bond yield 2.63%
30 year fixed rate mortgage 4.28%


Stocks are lower this morning on no real news. Bonds and MBS are flat.


Initial Jobless Claims fell slightly to 224k last week.


Durable Goods orders increased 0.4% in February, driven by an increase in commercial jet orders. Ex-transportation, they were down 0.1%. Core capital goods increased 0.8% as companies continue to plow capital back into expansion opportunities. Much of the increase in capital expenditures was in machinery, which is a positive sign for manufacturing. Still, economists are cautious on Q1 GDP, with many forecasting sub 1% growth for the quarter.


Construction spending rose 1.3% MOM and is up 0.3% YOY. Residential construction was down on a MOM and YOY basis. Housing continues to punch below its weight. Since construction is seasonally affected, January numbers tend to be a bit more volatile and have less meaning than summer numbers.


The MBA released its paper on CFPB 2.0, where they list out their recommendations for the CFPB. Much of what they say is similar to what Mick Mulvaney and Kathy Kraninger have been doing – increasing transparency regarding rulemaking and giving more guidance on what is legal and illegal. The Obama / Cordray CFPB was purposefully vague in promulgating rules, which makes life easier for regulators but makes it harder for industry participants. Regulation by enforcement was the MO of the Cordray CFPB, which ended with the new Administration, and the MBA agrees.


Specific to the mortgage business, the MBA recommends that the CFPB allow loan officers to cut their compensation in response to competitive dynamics, to extend the “GSE patch” which means loans that are GSE / government eligible are automatically considered to be QM compliant, to allow mortgage companies to pass on error costs to loan officers, and to raise the cap on points and fees.


CoreLogic looks at home price appreciation and the economic cycle. The punch line: While the current expansion is just short of a record length, and home price appreciation is declining, it doesn’t necessarily mean that house prices are in for a decline. In fact, housing typically weathers recessions quite well. I could caveat that the chart below only looks at a bond bull market. The 1978 – 1982 timespan of the misery index and inflation marked the bottom of the Great Bond Bear Market that lasted from the mid 1950s to the early 80s. The Great Bond Bull Market that began in the early 80s ended a few years ago, and while a bear market probably hasn’t begun yet the tailwind of interest rates falling from 17% to 0% isn’t going to be around this time. Finally, there are a few massive supports for the real estate market: rising wages, low inventory, and demographics. It is hard to imagine another 2008 happening if the economy peters out.


corelogic home prices

Morning Report: Appraised value and homeowner perception gap widens

Vital Statistics:


Last Change
S&P futures 2802 5
Eurostoxx index 374.06 0.81
Oil (WTI) 57.27 0.47
10 year government bond yield 2.62%
30 year fixed rate mortgage 4.28%


Stocks are higher this morning on no real news. Bonds and MBS are flat.


Inflation at the wholesale level came in below expectations, mirroring the consumer price index. The headline PPI rose 0.1% MOM / 1.9% YOY. Ex-food and energy the index rose 0.1% / 2.5% YOY.


Mortgage Applications rose 2.3% last week as purchases rose 4% and refis fell 0.2%. The MBA noted an uptick in FHA activity. “Purchase applications have now increased year-over-year for four weeks, which signals healthy demand entering the busy spring buying season. However, the pick-up in the average loan size continues, with the average balance reaching another record high. With more inventory in their price range compared to first-time buyers, move-up and higher-end buyers continue to have strong success finding a home.” said Joel Kan, MBA Associate Vice President of Economic and Industry Forecasting.


The gap between a homeowner’s perception of their home’s value and the number that the appraiser comes up with is starting to widen a touch. The Quicken Home Price Perception Index fell slightly in February, although the difference between perception and appraisal is pretty tight historically. For most MSAs, appraisals are coming in higher than homeowners expect, which is good news for the cash-out refi business. Given the direction in interest rates, home price appreciation is going to drive refi activity going forward.


Quicken HPPI


Wells Fargo CEO Tim Sloane appeared before the House yesterday to get called on the carpet for aggressive sales practices. “We have gone above and beyond what is required in disclosing these issues in our public filings, we have worked to remedy these issues, and, most importantly, we have worked to address root causes that allowed them to occur in the first place,” Sloan said in his written testimony to the House Financial Services Committee. “As a result, Wells Fargo is a better bank than it was three years ago, and we are working every day to become even better.” he said in a written statement.

Morning Report: Consumer inflation remains muted

Vital Statistics:


Last Change
S&P futures 2787 2
Eurostoxx index 372.85 -1
Oil (WTI) 57.27 0.47
10 year government bond yield 2.65%
30 year fixed rate mortgage 4.32%


Stocks are higher with a general “risk-on” feel to the tape. Bonds and MBS are down.


Lael Brainard speaks this morning and then the Fed enters its quiet period ahead of next week’s FOMC meeting.


Consumer inflation rose 0.4% MOM in February. Ex-food and energy, the index rose 0.4% and is up 2.1% YOY. Inflation remains under control, which should give the Fed the leeway to hold the line on rates next week. Falling energy prices at the end of 2018 helped keep the index under control, and we are seeing evidence that medical costs are finally stabilizing. Medical goods fell 1% MOM and services were flat. Stabilizing medical costs should translate into stable health insurance costs, which leaves more room for wage increases.


medical cpi


Retail Sales in January rose 0.2%, a touch higher than expectations. Those looking for a big rebound after December’s anemic numbers were disappointed. Given the strong consumption numbers in Q4 GDP, the holiday shopping season remains a bit of a mystery. The government shutdown is a possible explanation, and while it certainly hit the shops at Tyson’s Corner, the rest of the nation was unaffected. Note that the Fed’s consumer credit report showed that revolving credit increased only 1.1% in December and 2.9% in January, both well below run rates we have seen in the months leading up to it


Nancy Pelosi doesn’t support impeaching Trump. This is probably a tacit admission that the Mueller report isn’t going to contain anything we don’t already know.


Small business optimism rebounded in February. Earnings trends fell as many contractors were temporarily sidelined due to the government shutdown. Employment trends also slipped, probably for the same reason. Plans for expansion rose, however they are still below levels we saw in 2017-2018, which were extremely strong. Actual hires were the highest in years, and small business still finds a shortage of qualified workers. I am curious as to whether the “shortage of qualified workers” means (a) nobody around knows how to do the job, (b) nobody around knows how to do the job and can pass a drug test, or (c) nobody around that knows how to do the job will accept what I am want to pay.

Morning Report: More on Friday’s jobs report

Vital Statistics:


Last Change
S&P futures 2756 0.4
Eurostoxx index 371.87 1.24
Oil (WTI) 56.47 0.4
10 year government bond yield 2.65%
30 year fixed rate mortgage 4.32%


Stocks are flattish on no real news. Bonds and MBS are flat.


The upcoming week has a lot of economic data, however most of it is not housing related, and probably won’t be market-moving either. The biggest housing-related number will be new home sales and construction spending. We will also get inflation data and industrial production.


Friday’s payroll number was a definite downward surprise, and the question is whether this indicates a slowing labor market? Extremely low job prints happen occasionally we had sub-20k months in Sep 2017 and May 2016. Both prints ended up being a blip, and there is a good chance this gets revised upward in next month’s number. The number to take away from the jobs report is the increase in average hourly earnings. Average hourly earnings are a notoriously non-volatile series, and this one keeps inexorably increasing by larger and larger amounts.


average hourly earnings


Just because the US economy is doing relatively well, that doesn’t mean things are rosy overseas. China has had some bad days in the stock market, and the cracks are starting to appear in the economy. In Europe, the German Bund yield (The European benchmark) is about to go negative. Growth estimates have been slashed from 1.7% to 1.1%. So there is a bit of a global slowdown, and it means that we will probably take some shrapnel in the form of lower rates.


CFPB Chair Kathy Kraninger appeared before the House Financial Services Committee last week, and the commentary broke down along partisan lines. Democrats, pining for the Cordray days, had a laundry list of complaints, ranging from a de-emphasis on payday lenders to kvetching about changes in internal reporting lines. Republicans generally supported her and the agency’s end of regulation by enforcement. Kraninger reaffirmed the Agency’s commitment to chasing bad financial actors.

Morning Report: Surprising payroll number

Vital Statistics:


Last Change
S&P futures 2729.75 -20
Eurostoxx index 370.51 -3.3
Oil (WTI) 55.07 -1.53
10 year government bond yield 2.63%
30 year fixed rate mortgage 4.35%


Stocks are lower this morning after Chinese stocks fell 4.4% overnight. Bonds and MBS are up.


Jobs report data dump:

  • Payrolls up 20,000 (huge miss – Street was looking for 180k)
  • Unemployment rate 3.8%
  • Labor force participation rate 63.2%
  • Employment-Population Ratio 60.7%
  • Average hourly earnings up 3.4%

Surprisingly poor payroll number, and a bit of a suprise given the ADP number and all of the other numbers, which indicate strength. I suspect this will get revised upward next month. The average hourly earnings number is the highest in a decade, and probably is a better indicator of the health of the labor market than the payroll number. Still, the first indication of a labor slowdown will be a drop in hiring, so it bears watching.


Housing starts rose 1.23 million in January, which was a touch higher than the Street estimate. Building Permits rose 1.35 million, slightly above the 1.29 million estimate. January housing numbers are typically the nadir of the seasonal slowdown, so it is hard to read too much into them.


Labor productivity rose 1.9% in the fourth quarter as output increased 3.1% and hours worked increased 1.2%. Productivity is what allows non-inflationary growth and is the biggest input into higher standards of living. Unit Labor costs rose 2%.


Initial Jobless Claims fell to 223,000.


House Democrats have introduced legislation to prevent any sort of reform of the CFPB. Their big objection is the fact that Mick Mulvaney ended regulation by enforcement action, which was the practice of promulgating intentionally vague rules and then fining companies for violating them without saying what the rules exactly are. Since the government has unlimited resources and most companies don’t, they choose just to pay whatever the agency asks. Mulvaney also required the agency’s lawyers to conduct cost-benefit analyses for proposed regulations, which they also dislike. The bill has zero Republican sponsors, will go nowhere in the Senate, and is really nothing more than a messaging exercise.


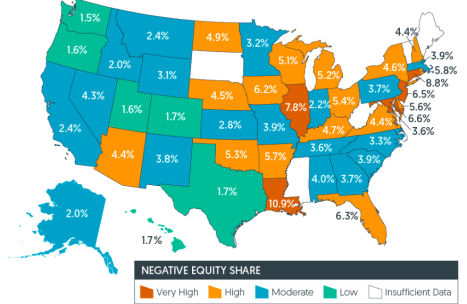
Rising home prices means rising home equity. In the fourth quarter, homeowners saw their equity increase by 8.1%, or $678 billion, according to CoreLogic. The number of homes with negative equity rose to 2.2 million units, however the amount of the negative equity also fell. Louisiana, Connecticut, and Illinois have the highest percentage of homes with negative equity, while Washington, Oregon, and Utah have the smallest.


negative equity

Morning Report: New home sales jump in February

Vital Statistics:


Last Change
S&P futures 2786.75 -4
Eurostoxx index 376.51 0.03
Oil (WTI) 56.07 0.4
10 year government bond yield 2.70%
30 year fixed rate mortgage 4.43%


Stocks are lower this morning on no real news. Bonds and MBS are up.


The economy added 183,000 jobs in February, according to the ADP Employment Survey. The Street is looking for about 180,000 additions in Friday’s employment situation report, so the ADP numbers seem to be in line.


Mortgage applications decreased 2.5% last week as purchases fell by 2.6% and refis fell 2%. The typical mortgage rate rose by 2 basis point to 4.67%.


The ISM non-manufacturing index expanded in February, which means that the services sector is picking up momentum.  The biggest issues seem to be potential trade issues, labor shortages and trucking costs.


New Home Sales rose by 621,000 in December. This is up 3.7% from the downward-revised November number, but down 1.5% from a year ago. For the full year, 622,000 homes were sold, which is slightly higher than the 613,000 sold in 2017. The median price was $318,000, while the average price was $377,000. The median sales price has been declining over the past year after peaking in November 2017 at $343,400. This demonstrates the shift from luxury to entry-level home construction to meet demand. This is a reversal of the early years of the crisis, when the luxury end of the market was the only part that was working.


Note that new home sales are about where they were during the 60s – 80s. Pretty amazing when you take into account that the US population has increased by close to 60% since 1970.


new home sales


Here is a copy of the letter that NAR, MBA, and a host of other housing advocates sent to Joseph Otting, Acting Director of the FHFA regarding GSE reform. It urges FHFA to go slow, work to maintain the 30 year fixed rate mortgage, and allow the GSE’s to act as a counter-cyclical buffer.


The Fed is catching up to the markets. Boston Fed President Eric Rosengren said it could be “several meetings” before the Fed gets enough clarity on the economy to make a move in interest rates. In many ways, he is acknowledging what the Fed Funds futures have been saying for a while now – that the Fed is going to wait and see how the 2018 hikes affect the economy before making any further moves. Since monetary policy generally acts with a 9 – 15 month lag, it means that the economy still hasn’t factored in the Sep and Dec hikes from last year.

Morning Report: Atlanta Fed is predicting 0.3% growth in Q1

Vital Statistics:


Last Change
S&P futures 2793.25 3.2
Eurostoxx index 374.38 -0.84
Oil (WTI) 56.73 0.14
10 year government bond yield 2.74%
30 year fixed rate mortgage 4.43%


Stocks are up on trade hopes. Bonds and MBS are flat.


Construction spending fell 0.6% in December, but was up 1.2% on a year-over-year basis. While the government shutdown may have had an effect on public construction spending, private construction spending was down the same amount. Housing continues to punch under its weight class, falling 1.4% MOM and 1.5% YOY. Public housing construction was even worse, falling 5% MOM and 20% YOY.


Now that more people are shopping for real estate online at sites like Zillow, Redfin and Realtor.com, the photos you use to show your property take on greater importance. Certainly it pays to have someone who knows what they are doing to photograph your home to put it in the best light, as opposed to simply posting photos from your phone. Now, with photo editing software getting cheaper and cheaper, more people are using edited photos to show their place. Some of this is innocuous: like photoshopping out your personal stuff in the kitchen and some of it is not: adding a pool or removing a wall. Given that 20% of homes are bought sight unseen, this is no longer a trivial, theoretical issue. It takes on even more importance given the move towards computer-generated appraisals.


Mortgage rates tend to vary across states. For example, the cheapest state to borrow in is California, where the average rate is 4.74%. The most expensive is NY, where the average rate is 4.96%. The US average is 4.84%. You would think that judicial versus non-judicial foreclosure laws would explain the difference (you can live in your foreclosed house for years in NY), but maybe there is more going on here. Guess what the second-lowest rate state is: New Jersey, which has a pretty similar foreclosure legal structure.


Yesterday I mentioned that strategists and the Atlanta Fed are extremely bearish on Q1 GDP growth, figuring that it will come in under 1%. A couple of points: First, Q1 GDP has been weak for the past several years. It might be a measurement issue or something spurious, but that is one reason economists might be cheating down the number a tad. Second, if Q1 GDP comes in around 1%, you can probably forget about any rate hikes this year. For what its worth, the Fed Funds futures are predicting a 94% chance of no hikes this year and a 6% chance of 1 hike.


HUD Secretary Ben Carson plans to leave the Administration at the end of Trump’s term, where he will return to the private sector.

Morning Report: Homeownership rate increases in Q4

Vital Statistics:


Last Change
S&P futures 2814 6.75
Eurostoxx index 376.36 1.22
Oil (WTI) 56.49 0.7
10 year government bond yield 2.74%
30 year fixed rate mortgage 4.44%


Stocks are higher this morning on real news. Bonds and MBS are down.


The big data this week will be the jobs report on Friday. Jerome Powell said in his Humphrey-Hawkins testimony that he would like to see further wage increases, which should calm the bond markets if the average hourly earnings number comes in a bit hotter than expected. Other than that, we will get new home sales and the ISM data.


The homeownership rate ticked up to 64.8% in the fourth quarter, according to the census bureau. This is up from 64.4% in the third quarter and 64.2% a year ago. The homeownership rate has been slowly ticking back up after bottoming at 62.9% in 2016. Note that we are nowhere near the highs of around 69.2% during the bubble years. Bumping up that number by lending to Millennial borrowers is going to drive the mortgage business going forward, and will have to replace the rate / term refi business that drove earnings for years.


homeownership rate


28 organizations, including the MBA, NAR and a whole host of affordable housing advocates sent a letter to Acting FHFA Director Otting counseling him to go slow in GSE reform.  “A well-functioning housing finance system should provide consistent, affordable credit to borrowers across the nation and through all parts of the credit cycle without putting taxpayers at risk of a bailout,” the letter states. “We urge policymakers to take these principles into account to ensure that access and affordability are preserved under the current, and any future, housing regime.” FHFA had indicated it was willing to make some reforms without Congress, which prompted the letter. Any true GSE reform will require legislation.


Despite a strong Q4 GDP print of 2.6%, first quarter estimates are in the 0% to 1% range. Does the economy “feel” like it rapidly decelerated in the past couple of months? Some of the numbers suggest it – as in personal income and consumption.  I don’t sense it, but that’s what the pros are saying. As a general rule, people’s subjective assessment of the economy is often influenced by their personal partisan values. When Democrats are in charge, Republicans tend to feel the economy is worse off than it really is, and the same goes in reverse. During the Obama years, the professional economists (including the Fed) were consistently high on their GDP estimates. Now, during the Trump years, professional economists seem to be undershooting the numbers – i.e. actual growth numbers out of the BEA are much higher than forecast. I doubt there is any tampering going on, but it is something to keep in mind, especially when locking around big economic events.

Morning Report: 2018 GDP highest in 12 years

Vital Statistics:


Last Change
S&P futures 2788 -6.75
Eurostoxx index 371.36 -1.22
Oil (WTI) 56.82 -0.13
10 year government bond yield 2.67%
30 year fixed rate mortgage 4.34%


Stocks are lower this morning on no real news. Bonds and MBS are down.


Fourth quarter GDP came in at 2.6%, a deceleration from the third quarter reading of 3.4%, but much higher than many in the political economic punditry were predicting. Consumer spending rose 2.8%, while inflation rose 1.6%. Inflation fell from 1.8% in the third quarter. For 2019, GDP came in at 2.9%, the highest reading since 2006.


Initial Jobless Claims rose to 225,000 continuing a string of extremely low readings.


One of the most politically explosive issues these days concerns wage growth – why it seems to be so low and what can be done about it. Many will misinterpret cherry-picked numbers to make the claim that wages have not increased for 40 years, which is preposterous. That said, wage growth has been running in the high 2s, and with inflation around 2%, that equates to under 1% real wage growth. Modest, but certainly not what you would expect, especially this far into a recovery, especially with unemployment running below 4%. If the numbers don’t appear to comport with common sense, often times there is an issue with the numbers.  That seems to be the case here. It turns out that wage growth is quite a bit higher, and it is due to the measurement problems inherent in the Bureau of Labor Statistic’s calculations. The BLS basically adds up wages paid and divides it by hours worked. If higher paid older workers are exiting, and younger lower paid workers are entering it will depress the averages, and it won’t accurately measure the growth that someone who has stayed in the labor force for the entire year has seen. Take a look at the chart below, where the Fed imputed average wage growth from census data as opposed to the BLS. Wage inflation jumps from 3% to 5%, which makes a lot more sense given the current economic numbers.


average hourly earnings vs census


Toll Brothers reported an increase in pretax earnings and sales for the first quarter of 2019. Orders declined in a big way however, falling 24% in units and 31% in dollars, driven primarily by weakness in California. Home price appreciation has been moderating in the hotter markets, and it is especially pronounced in the luxury segment, where Toll resides. The cancellation rate jumped to 9.6% from 5.3% a year ago. Tax reform limited the mortgage interest deduction, and the luxury segment is most prominent in high tax states, so those two effects are squeezing demand.


Realtor.com predicts this year’s Spring Selling Season could be the weakest in years despite rising inventory. While lower rates have improved conditions compared to late 2018, we are still weaker than early 2018.