Morning Report – The Fed frets about excessive risk-taking 6/4/14

Vital Statistics:


  Last Change Percent
S&P Futures  1917.9 -3.9 -0.20%
Eurostoxx Index 3240.1 -7.7 -0.24%
Oil (WTI) 102.5 0.1 0.06%
LIBOR 0.227 0.000 0.11%
US Dollar Index (DXY) 80.49 -0.150 -0.19%
10 Year Govt Bond Yield 2.55% 0.02%  
Current Coupon Ginnie Mae TBA 106.5 0.1  
Current Coupon Fannie Mae TBA 105.5 0.1  
BankRate 30 Year Fixed Rate Mortgage 4.18    


Stocks are down (and bonds are up) after the weak ADP jobs report, which is signalling a weak nonfarm payrolls number on Friday. 
 
ADP payrolls came in at 179k, below the 210k expectation. The Street is forecasting 215k jobs for Friday’s report. FWIW, the ADP report has been downright lousy at predicting the big number lately (notwithstanding last month), so I wouldn’t read too much into it. 
 
Mortgage applications fell 3.1% last week, even though mortgage rates fell a couple bps. Purchasese fell 3.6%, while refis fell 2.9%. 
 
The final revision for first quarter productivity came in at -3.2%. Unit labor costs rose 5.76%. Not sure how much of that was driven by obamacare / bad weather. Flattening productivity growth could be a good thing generally, as it means employers have squeezed just about all they can get from current employees and will need to hire more (or spend more on CAPEX). Either one is bullish for the economy.
 
The ISM Services index jumped to 56.3 in May, versus 55.2 in April and expectations of 55.5. Not quite post recession highs, but close. So we continue with the pattern of strong data, weak data. 
 
The Markit US Services PMI and composite PMI were both strong, although a little weaker than April. Still a 58 handle is a good number regardless.
 
The census bureau has a cool application where you can find out all about trends in home construction – things like typical number of bedrooms, number of bathrooms, square footage, amenities. One thing that jumps out is that the luxury end is doing better – we are building less homes under 1800 square feet, and the big percentage growth is in the 4000 + square feet bucket. The smaller starter homes probably won’t get built until the first time homebuyer feels confident enough about the future to buy. Household formation remains depressed, which is keeping housing starts depressed, which is keeping the economy stuck on a 2% growth trajectory instead of a 3% growth trajectory. The turnaround will happen – I thought it would be this year, but it is looking like a 2015 event. I’m starting to feel like Linus in the pumpkin patch preaching about pent-up demand, while waiting for a 1.5 million housing starts print.


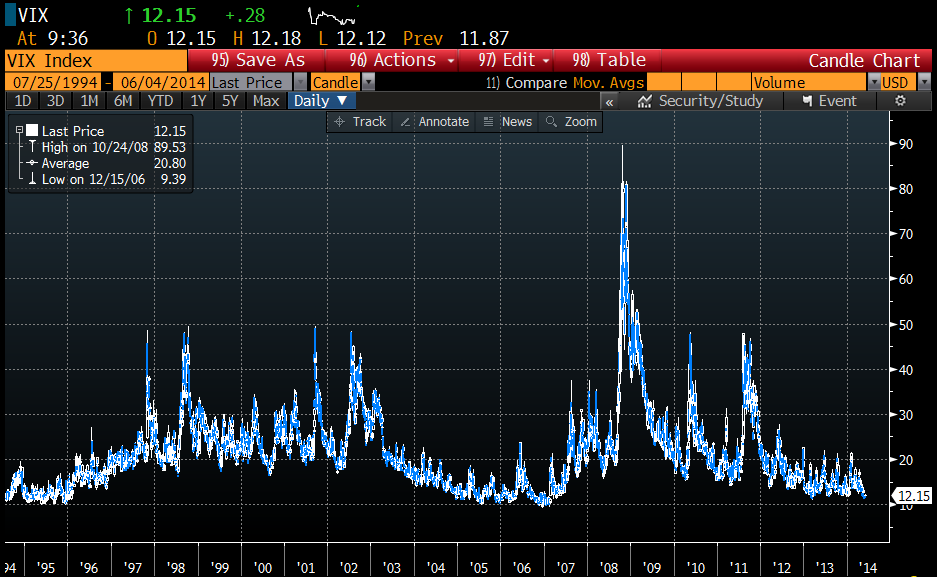
The calm before the storm? The Fed is worried about complacency in the markets. The VIX index has gone 74 straight weeks below its long-run average, which is a similar environment to 2006 – 2007. Junk spreads are widening, and junk issuance is growing as investors reach for yield. William Dudley commented: “Volatility in the markets is unusually low… I am a little bit nervous that people are taking too much comfort in this low-volatility period. As a consequence, they’ll take more risk that really what’s appropriate.” For what its worth, I think the VIX is useful for describing what has already happened in the market, not as a predictor of what is going to happen. Yes, there is the old market saw of “VIX is high, time to buy, VIX is low, time to go,” but a low VIX doesn’t necessarily mean markets are going to fall out of bed – look at the low VIX levels in 94-95, which preceded the mother of all stock market rallies. VIX invariably spikes AFTER the fit hits the shan, not before. It represents market players paying up for option protection, and that is a trailing indicator, not a leading one.


With respect to the junk issuance, investors (in particular defined benefit pension funds and insurance companies) are reaching for yield because the rate of inflation for their liabilities is largely insensitive to interest rates. The actuarial tables couldn’t care less if the Fed is driving down rates via QE – they need to earn X% on their fund to cover expected costs and that’s that. If they can’t get that in Treasuries, they’ll move to assets that can. Invariably that means they have to move out on the risk curve. We have seen this movie before, in the 1950s. FWIW, Dr. Cowbell thinks low rates are here to stay, and that “this time is different.” Most dangerous words in investing, ever. Anyway, it is nice to see the Fed muse about excessive risk taking, although IMO the biggest risk is probably in the so-called “risk free” long bond. 


Morning Report – 40% of modded mortgages are still underwater 6/3/14

Vital Statistics:

Last Change Percent
S&P Futures 1917.9 -3.9 -0.20%
Eurostoxx Index 3240.1 -7.7 -0.24%
Oil (WTI) 102.5 0.1 0.06%
LIBOR 0.227 0.000 0.11%
US Dollar Index (DXY) 80.49 -0.150 -0.19%
10 Year Govt Bond Yield 2.55% 0.02%
Current Coupon Ginnie Mae TBA 106.5 -0.1
Current Coupon Fannie Mae TBA 105.5 -0.2
BankRate 30 Year Fixed Rate Mortgage 4.18


Markets are lower this morning on no real news. Bonds and MBS are down. The automakers will be releasing May auto sales throughout the day – so far GM and Ford have both reported strong numbers.
In other economic data, ISM New York increased from 50.6 to 55.3. April factory orders increased .7% (and March was revised upward from 1.1% to 1.5%). Finally, the IBD / TIPP Economic Optimism Index came in better than expected to 47.7 from 47.
Yesterday, bond traders were given a quite the headfake with two incorrect reports for the ISM Manufacturing Index (a rather important economic indicator). The initial report had the index missing expectations significantly – a reading of 53.2 versus expectations of 55.5. This was a bond bullish number. However, later that morning they corrected the number to 56. Stronger number, so bond bearish. Finally, they got it right and reported the true number 55.4 – more or less in line with expectations. The market was probably more sensitive to this number than it should have been, but April’s economic data has been all over the place, and Friday’s jobs report looms large.
Home Prices increased 10.5% nationwide in April, according to CoreLogic. They are forecasting home price appreciation to moderate over the next year, with a prices expected to increase 6.3%. Excluding distressed sales, prices increased 8.3%. Overall, prices remain 14.3% below their April 2006 peak. Note that the FHFA Home Price Index has us within about 6% of the peak, but FHFA is a subset of the market in that it only looks at homes with conforming mortgages on them. 95% of the MSAs reported price increases.
The latest Black Knight Mortgage Monitor is out, with data through April 2014. Roughly 40% of the homes who received mortgage modifications are still underwater. We are finally seeing the judicial foreclosure states work through their pipelines, which is why we are starting to see more home price appreciation there. New York and New Jersey are making progress, while Massachusetts is not (and in fact is suing Fannie and Freddie over resisting their foreclosure prevention program). Sadly, it never seems to occur to politicians that policies designed to prevent foreclosures prevent price appreciation. They have this view that home prices are simply too important to be determined by a mere market.


Morning Report – The bubble in bonds 6/2/14

Vital Statistics:

Last Change Percent
S&P Futures 1922.6 1.1 0.06%
Eurostoxx Index 3248.0 3.4 0.11%
Oil (WTI) 102.4 -0.3 -0.27%
LIBOR 0.227 0.000 -0.11%
US Dollar Index (DXY) 80.52 0.147 0.18%
10 Year Govt Bond Yield 2.50% 0.03%
Current Coupon Ginnie Mae TBA 106.6 -0.1
Current Coupon Fannie Mae TBA 105.8 -0.1
BankRate 30 Year Fixed Rate Mortgage 4.15


Markets are flattish on no real news. Bonds and MBS are down
More disappointing economic data – the ISM Manufacturing report dropped from 54.9 to 53.2 in May and construction spending rose .2%. Both numbers were below expectations.
We will get the jobs report on Friday, and given the almost contradictory economic data we have been getting, I have no idea what to expect. I could see a 100k print. I could see a 300k print. FWIW, the street is at 215k, with a tick up in the unemployment rate to 6.4%.
Cash deals account for 29% of all sales, according to Bloomberg. Retiring baby boomers are choosing to own homes outright, as opposed to having a mortgage. Historically that number has been closer to 20%, and I have seen cash estimates as high as 40%.
In a related note, QE has rendered many economic risk models (particularly the Fed model for stocks) useless. Old definitions of “cheap” and “expensive” no longer apply in a world of unprecedented central bank stimulus and stubbornly low inflation. When investors start re-defining what “cheap” and “expensive” mean (think internet stocks in 1999), that is a signal that we are in bubble territory.
I would like to tie the two articles together – what sort of bet is buying a house with cash? Well, it is a real estate bet- going long real estate. However, by choosing not to get a mortgage, it is also a bond bullish bet, in a way. Lending is the act of going long bonds. Borrowing is the act of going short bonds. IMO, the baby boom is effectively doubling down on the bond bullish bet. They are making a very questionable bet that central banks around the world can stick the landing and exit this unprecedented stimulus without (a) crashing the bond market and (b) creating inflation. IMO, the risks are all to the downside in the bond market, and instead of buying homes with cash, I would be borrowing as much as I could at 4% interest rates. The baby boom drove the stock market bubble in the late 90s, the residential real estate bubble in the 00s, and are drinking the bond market kool aid now. I don’t think this ends well.