

Stocks are lower this morning on bad export numbers out of China. Bonds and MBS are up.
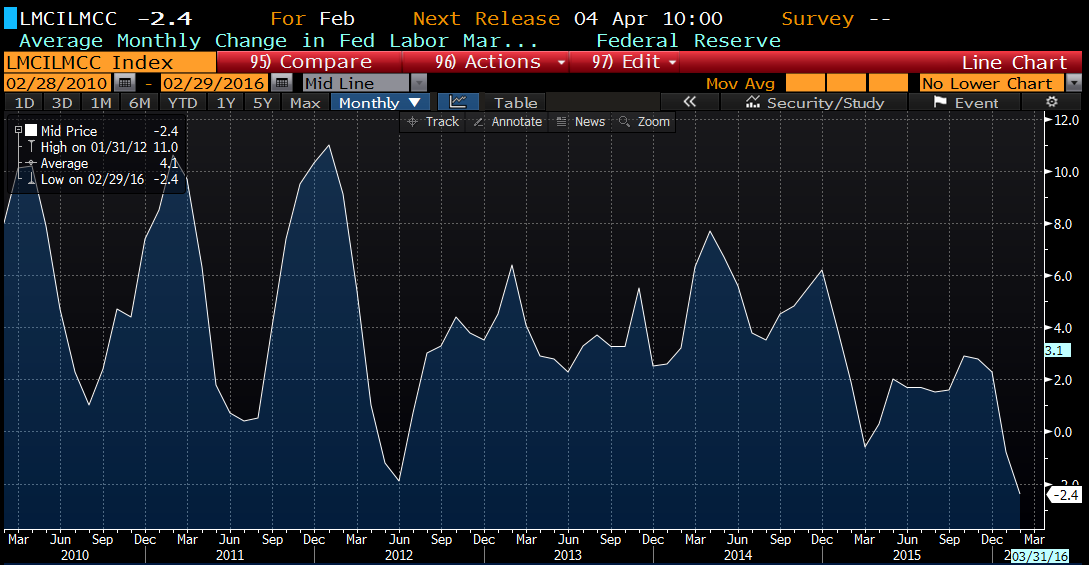
The US Labor Market Conditions Index fell in February, This is a relatively new index created of 19 different labor market indicators. Not sure what caused the recent drop in the index, as most of the big indicators are positive. Perhaps the disappointing wage growth in the last jobs report is causing it. Certainly the labor market does not seem to be the worst in four years..
Consumer credit rose by $10.5 billion in January, the lowest in a year. Lower levels of credit card debt drove the deceleration.
Small Business Optimism hit a 2 year low, according to the NFIB. Worryingly, job creation fell for the first time in quite a while, as small businesses shed about .12 workers per firm. The difficulty in finding qualified workers also fell in importance, although it is still elevated. Washington remains the biggest impediment, with taxes and red tape occupying the #1 and #2 concerns for small business. The report summed it up this way: “Overall, a “ho hum” outcome, confirming that the small business sector is not headed up with any strength, just treading water waiting for a good reason to invest in the future.”
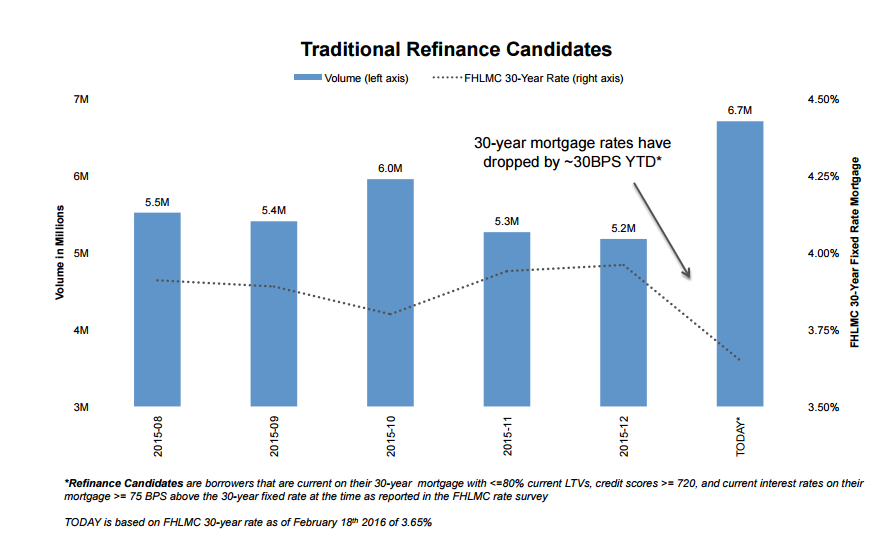
The big drop in interest rates has bumped up the refinanceable population to 6.7 million borrowers from 5.2 million last month, according to Black Knight Financial Services. An additional 15 basis point drop in rates would add another 2.1 million borrowers. This data is based on mid-February numbers, with a FHLMC 30 year rate of 3.65%. Just another reason why 2016 might be a little better than expected.
Foreclosure activity continues to fall, according to CoreLogic. Foreclosure inventory is down 21.7% to 456,000 homes, and completed foreclosures fell 16% in January. Serious delinquencies also fell to 1.2 million mortgages, the lowest since 2007. Foreclosure activity is making the home price recovery more durable: “The improvement in distressed properties continues across the country in every state which is contributing to the lack of stock of available homes and resulting price escalation in many markets,” said Anand Nallathambi, president and CEO of CoreLogic. “So far the trend toward lower delinquency and foreclosures has been immune from shocks from such things as the collapse in oil prices attesting to the durability of the housing recovery.”
Filed under: Economy, Morning Report |

Heh, heh, heh. . .
Frist!
LikeLiked by 1 person
Happy International Women’s Day!
LikeLiked by 2 people
Why, thank you! I’m talking myself out to dinner at Bo Brooks to celebrate. 🙂
LikeLike
Is Caitlyn Jenner allowed to celebrate? Not sure what the protocol is these days…
LikeLike
Brent:
Is Caitlyn Jenner allowed to celebrate? Not sure what the protocol is these days…
No, she/he is not allowed to celebrate because he/she is a republican.
LikeLike
Sure, AFAIC. Uterus not required.
Heck, men who love women are allowed to celebrate, too!
LikeLike
It’s been my experience that men make better women than women do.
LikeLike
Nice boots. Eh, I guess I can live without being Frist all the time. 😉
LikeLiked by 1 person
Kinky Boots!
We watched the movie years ago and hope to catch the show when it hits the Kennedy Center later this year. Whatever Lola wants, Lola gets.
BB
LikeLiked by 1 person
I saw it already this season. The touring show is good.
LikeLike
If Trump wins, this is why. Not racism or bigotry. Trade.
http://www.theguardian.com/commentisfree/2016/mar/07/donald-trump-why-americans-support
LikeLike
As a former denizen of the rust belt, I can say that trade and immigration are big bipartisan hot button items.
LikeLike
I think there are a lot of ways. Trade, obviously, but a sense of both abandonment and entitlement from the GOP. Also, the establishment GOPs response to Trump. Also, the things where GOP elites are saying they’ll purposely torpedo the Republican party to beat Trump, and think that’s a good idea both for the future of the Republican party and their own position as political kingmakers. Also, his big mouth and huge balls. Also, not Ted Cruz or Rubio or Hillary. I think there’d be a lot of factors. Some more relevant to the primaries, some more relevant to the general, obviously.
LikeLike
and Michigan’s results seem to back this up.
LikeLike
The Science is In!
“Hottest Year Ever!” also part of data that indicates no warming in 58 years.
http://realclimatescience.com/2016/03/noaa-radiosonde-data-shows-no-warming-for-58-years/
… but if you work the numbers right, they show immediate disaster!
LikeLike
Why do you hate Gaia, bagger?
LikeLike
The environmentalists are pushing the big banks to not finance any more coal mines or plants… And they are winning…
http://www.bloomberg.com/news/articles/2016-03-07/jpmorgan-won-t-finance-new-coal-mines-that-worsen-climate-change
LikeLike
Neat graphics. Scary possibility.
http://www.texastribune.org/hell-and-high-water
LikeLike
We’ve handled 3 Cat 2’s in the last 10 years, with Ike coming right up the poop chute.
LikeLike
It is true that the middle class has shrunk. But so has the lower class. That can only mean one thing….and it is good, not bad.
https://www.aei.org/publication/middle-class-disappeared-higher-income-groups-recent-stagnation-explained-changing-household-demographics/
1. From 53% in 1967 (and a slightly higher 54.7% in 1968), the share of “middle-income” US households earning between $35,000 and $100,000 (in 2013 dollars) has been gradually decreasing over the last half-century as the NY Times points out. Over the 47-year period between 1967 and 2013, the share of “middle-income” American households has fallen by ten percentage points, from 53% in 1967 to about 43% in 2013. So the Census Bureau data on household income reveal a definite decline in the share of “middle class” households in America, confirming the reports we hear all the time about the “disappearing middle class” (47,000 results from a Google search).
2. But where did the disappearing middle class go? Did they fall into the lower-income category? Not at all, because the share of “lower-income” US households earning less than $35,000 also fell over the last 47 years by about five percentage points, from 39.3% of all US households in 1967 to 34.4% of households in 2013.
3. The biggest shift in household income between 1967 and 2013 took place for the share of American households earning $100,000 or more, which almost tripled from only a 7.7% share of US households in 1967 (1 in 13 households) to a 22.5% share of US households in 2013 (almost one in four). That nearly 15 percentage point increase in the share of US households earning $100,000 or more between 1967 and 2013 (from 7.7% to 22.5%) came about from a 10 percentage point decline in middle-income households (from 53% to 43%) and a 5 percentage point decline in lower-income households (from 39.3% to 34.4%). So as I concluded before, a large part of the middle class did disappear, but they didn’t fall down to a lower-income class, they rose into the upper-income class!
LikeLike
I remember when I first found that stat and you and I discussed it. Every time I hear “the vanishing MC” I think about it.
LikeLike